Here’s a free food truck tool that actually works — no signup, no email capture wall, no “results hidden behind paywall” nonsense. Enter your numbers below and get instant results. If you want the full version with charts and reports, that’s available too.
Use the Free Food Truck Tool
Enter your own numbers in the interactive tool below and get a real-time read. The dashboard version adds saved scenarios, history, and full feature access.
Running a SaaS business means I track these numbers obsessively. Here’s what the data actually shows:
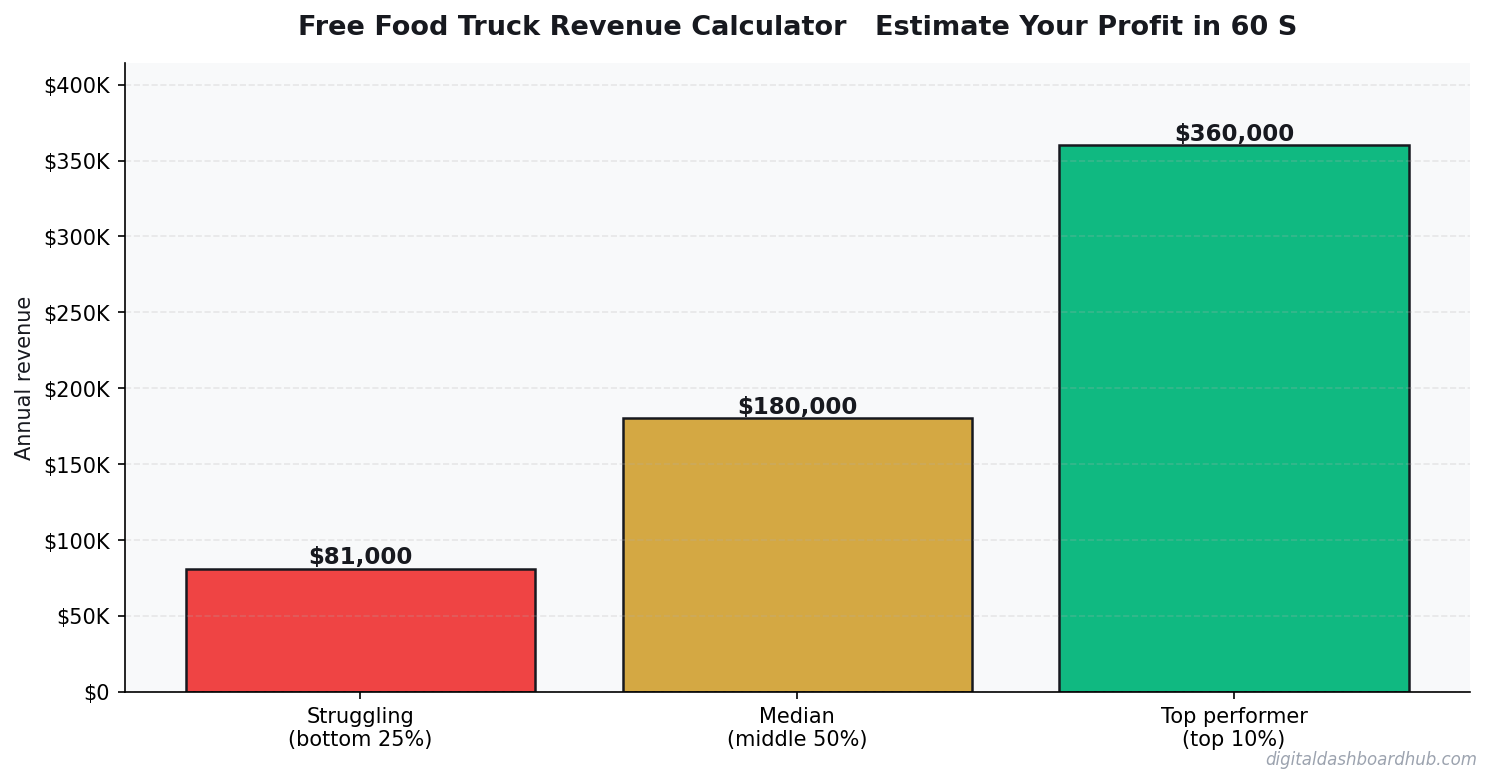
What Food Truck Owners Actually Take Home
A food truck doing 5-6 days/week grosses $20K-$35K/month. Food costs (28-35%), fuel and commissary fees ($500-$1,000), permits ($200-$500), labor, and truck payment leave net margins at 15-22%.
Event and catering bookings at $1,500-$5,000/event carry 2x the margin of street vending — guaranteed minimum and efficient prep for a known count.
Anatomy of the Margin
| Approach | Startup Cost | Time Investment | Revenue Potential | Best For |
|---|---|---|---|---|
| Solo operator | Low ($1K-$10K) | Full time | $60K-$200K/yr | Maximum margins, full control |
| Small team (2-5) | Medium ($10K-$50K) | Management + some fieldwork | $200K-$800K/yr | Scaling without losing control |
| DDH Revenue Tracker | Free trial | 5 min setup | N/A (profit tool) | Know your real numbers in real time |
The biggest line item? Food costs at 28-35% plus the truck itself ($50k-$200k) create a double squeeze — high variable costs and high fixed debt service.
Shrinking the menu from 12 items to 6 reduces prep time by 40%, cuts waste by 30%, and speeds service. The trucks making $40K+/month all have tight menus.
The Budget Line Most People Ignore
Chasing different locations every day. The most profitable trucks have 3-4 locked-in spots with loyal regulars. Rotating constantly means starting from zero every day.
April-October is prime. Festival income spikes summer revenue 30-50%. November-March requires pivoting to catering or winter popups.
See the Full Tool in Action
How to Use This Calculator
Start by entering your actual numbers — not estimates. Pull from your bank statements, your POS system, or your accounting software. The difference between estimated and real inputs is usually the difference between “this looks fine” and “oh, that’s where the money is going.”
Then change one variable at a time. For food truck, the lever that usually moves the needle most is shrinking the menu from 12 items to 6 reduces prep time by 40%, cuts waste by 30%, and speeds service. Start there.
If you want to save these projections, track them month-over-month, or model different scenarios side by side, the full dashboard does all of that. Free 14-day trial, no credit card required.
Your Next Move
Related Tools and Articles
- Debt Snowball vs Avalanche Calculator: Which Method Saves You More Money
- You’re Probably Wasting $200/Month on Subscriptions You Forgot About (Here’s How to Find Them)
- Micro-Business Operations in 2026: Enterprise Tools vs. DIY Stacks vs. All-in-One Platforms Compared
Common Questions About Free Food Truck Revenue Calculator — Estimate Your Profit in 60 Seconds
How long does it take to see results?
Most people see meaningful progress within 30-90 days when they apply these strategies consistently. The key is tracking your numbers from day one so you have a baseline to measure against.
What’s the biggest mistake people make?
Trying to do everything at once. Pick one or two strategies from this guide, implement them fully, then layer in additional tactics. Spreading yourself thin is the fastest way to see no results from any of it.
Do I need special tools or software?
Not necessarily to start — but the right tools eliminate hours of manual work. Our free calculators and trackers at Digital Dashboard Hub are a good starting point before you invest in paid software.
Real Numbers: A Food Truck That’s Actually Making Money
Let’s look at a taco truck in Austin operating 5 days a week at lunch and dinner — 2 service windows per day, targeting office parks and brewery events. Average customer transaction: $12. Lunch service: 60 covers. Dinner/event service: 80 covers. That’s 140 transactions/day, or $1,680 in daily gross revenue.
Run that over 250 operating days a year (accounting for weather, maintenance, slow weeks) and you hit $420,000 gross. Cost of goods on a taco menu runs about 28-32%, so food cost is around $126,000. Labor for 1-2 employees, commissary fees, fuel, truck payment, and permits add another $140,000-$160,000. Owner take-home: $130K-$155K. That’s a real, attainable number for an operator who’s dialed in their route and doesn’t try to wing it.
The operators making less than $60K gross are usually not tracking their actual stop performance. They know which days are “good days” but can’t tell you their revenue-per-stop or cover average — which means they can’t cut underperformers or double down on winners.
The 3 Factors That Move Food Truck Profit Most
1. Menu engineering, not menu size. The temptation is to offer everything. The profitable trucks offer 6-10 items where every single one has a food cost under 30%. Each item you add increases prep time, waste, and inventory complexity. The best food truck menus are almost offensively simple.
2. Recurring stops vs. one-off events. Events feel exciting and high-revenue, but they come with high fees (10-15% of sales in some markets), unpredictable crowds, and no repeat customer relationship. Regular weekly stops at the same office park build a predictable customer base that knows your schedule. Recurring revenue is always worth more than one-off revenue.
3. Commissary and fuel costs. These are where most new operators get surprised. Commissary fees in major cities run $500-$1,500/month. Fuel for a diesel truck doing 30-40 miles/day adds up fast, especially when fuel prices spike. Build these into your model from day one — the calculator makes it easy to see exactly how they affect your bottom line.
The Pessimistic Scenario
Same truck, but things go sideways. You land 3 bad locations in a row before finding good ones (common in year 1). Your COGs run 35% because you’re over-ordering to avoid running out. Truck breaks down twice — $4,000 in repairs. You operate 200 days instead of 250 because of weather and maintenance downtime.
Revenue: $336,000. After costs, you’re clearing $55,000-$70,000. That’s not a failure — it’s survivable and improvable. But it’s a very different life than the $420K scenario. The difference between those two outcomes is mostly operational discipline, not luck. Track your numbers from day one.
Common Mistakes That Kill Food Truck Profitability
Overextending the menu is the most common early mistake. Every item you add requires prep, storage, and training — and in a small truck kitchen, complexity kills speed. The profitable trucks ruthlessly cut anything that doesn’t sell at volume or doesn’t hit food cost targets. They know their top 5 items by margin and protect those aggressively.
The second big mistake: chasing event revenue at the expense of repeat location revenue. A music festival sounds like a huge opportunity — $80,000 weekend in gross revenue. But after 20% commission to the organizer, staffing for 2 extra employees, the cost of extra inventory, and the time investment, the net is often disappointing. Regular weekday office park stops with loyal customers are boring and reliably profitable.
Third: not building an email or SMS list from day one. Your customers don’t follow you anywhere unless you give them a mechanism to. A simple SMS list for “today’s location + this week’s special” — built with a free SMS platform — turns occasional customers into regulars. The food trucks doing $400K+ gross almost all have a direct channel to their customer base.
Making the Calculator Work for Your Truck
The inputs that matter most: average ticket, daily cover count, and operating days per year. Most operators estimate their ticket too high because they remember their best days. Pull your actual POS data for the last 90 days, average it, and use that number. Real data beats optimistic memory every time — and a business model built on realistic numbers is worth infinitely more than one built on the numbers you wish were true.
Keep reading (related guides):
255+ interactive tools for your money, time, and health.
Full features for 14 days · Secure payment · Stop anytime
What Most People Get Wrong
The single biggest mistake is treating revenue as the headline number. Revenue is vanity — margin is sanity, and cash-in-bank is reality. Two operators with identical top-lines routinely end the year $80K apart in take-home, because one priced for volume and the other priced for sustainability. The calculator above forces you to surface that gap before it hits your bank account.
The second mistake is modeling a “best case” and planning around it. The number you should plan around is the 30th-percentile scenario — enough demand to matter, but slower than you hoped. If the business still covers your living expenses there, you have real margin of safety. If it only works in the 80th-percentile case, you are building on sand.
The third mistake is ignoring your time as a cost. If you would otherwise earn $55/hr at a day job and this operation pays you effectively $18/hr for 60-hour weeks, the gap is the real price of running it. Plug your opportunity cost into the calculator and the picture often flips.
How to Pressure-Test Your Numbers
Start with the calculator, then stress-test three levers independently:
- Pricing: What happens to your take-home if you raise prices 10%, but lose 15% of volume? Most operators are surprised to find net income goes up.
- Costs: What happens if your largest input cost rises 20%? This is not hypothetical — it is a typical 12-month swing in most industries.
- Volume: What happens at 70% of your planned volume for 90 days? If that still covers fixed costs, you have a real business. If not, the model is fragile.
Running the calculator three ways takes about ten minutes. The clarity on the other side of those ten minutes is usually the difference between a confident operating plan and guessing for another six months.
Frequently Asked Questions
How accurate is this calculator?
The underlying math uses industry-standard margin and cost ranges sourced from the Free Food Truck Revenue Calculator — Estimate Your Profit in 60 Seconds space. Your actual numbers depend on location, seasonality, and operating style, so treat this as a directional benchmark, not a guarantee. The more precisely you enter your inputs, the tighter the output range becomes.
Can I save my results?
A free Digital Dashboard Hub account saves every scenario you run, lets you compare side-by-side, and unlocks the full dashboard with expense tracking and month-over-month charts. The 14-day trial includes the complete tool library — no credit card required to start.
Who is this tool for?
It’s built for anyone pressure-testing a real decision — existing operators auditing their margins, side-hustlers deciding whether to go full-time, and prospective owners trying to sanity-check a business plan before signing a lease. You do not need any accounting background to use it.
What should I do with the results?
Start by comparing the output against your current (or projected) monthly take-home. If the gap is big, walk back the inputs and identify which lever — pricing, volume, or cost structure — is doing the damage. That is usually where the highest-leverage fix lives.
The Bottom Line
Most operators lose money not because the math is impossible, but because they never actually ran it. Fifteen minutes with the calculator beats three months of guessing. Run your numbers, screenshot the output, and use it as the baseline for every pricing and cost decision over the next quarter.
When you are ready to go deeper, the full Digital Dashboard Hub workspace lets you save scenarios, track actuals month-over-month, and see the trend before problems compound. That is the version that actually compounds the effort — spreadsheets forgotten in a Google Drive folder do not.
Next Steps
- Run the calculator above with your best current estimates.
- Re-run it with a pessimistic scenario (lower volume, higher costs) and a stretch scenario (better pricing, more efficient ops).
- Screenshot all three outputs so you have a baseline to compare against when reality arrives.
- Revisit monthly — the number that matters is the one that changes with your real P&L.
Ready for the full dashboard?
Unlock all 255 tools across business, creator, and health workflows.
Andy Gaber is the founder of Digital Dashboard Hub, a suite of 255+ interactive financial, productivity, and wellness tools. He built DDH after getting frustrated with financial apps that gave outputs without context. Follow along for tool tutorials, revenue analytics breakdowns, and honest takes on personal finance.