amazon-fba-won-t-look-like-the-youtube-gurus-promise”>Your First Year on Amazon FBA Won’t Look Like the YouTube Gurus Promise
The dashboard below loads instantly in your browser. Plug in your numbers, see your answer. No signup to try the basics.
Every FBA “success story” starts at month 12 and pretends months 1-6 didn’t happen. The reality? Most sellers lose money for 3-4 months, break even around month 5, and don’t see real profit until month 7 or later. That’s not failure — that’s the actual curve.
I built this calculator because the projections floating around online are either wildly optimistic (the guru pitch) or uselessly vague (“it depends”). You deserve a month-by-month model that accounts for the PPC learning curve, organic keyword ranking, inventory reorders, and the seasonal rollercoaster that defines year one.
What Most First-Year Revenue Projections Get Wrong
The biggest lie in FBA content is treating revenue as linear. “If you sell 10 units a day at $25, that’s $7,500/month!” Sure — except you won’t sell 10 units a day in month one. You’ll sell 2-3 while Amazon’s algorithm figures out if your listing deserves traffic.
From my testing the real curve looks like for a typical private-label product launched at $25-35:
Notice the PPC spend drops over time. That’s because organic rankings improve as your listing accumulates sales velocity and reviews. By month 6-8, organic sales should outpace PPC-driven sales — if your product and listing are solid.
The 4 Phases of Year One
Phase 1: The Launch Burn (Months 1-2)
You’re spending aggressively on PPC to generate initial sales velocity. ACoS (Advertising Cost of Sale) runs 40-80%. You’re basically paying Amazon to let customers find you. This is normal. Budget $1,000-$2,500 for PPC in these two months alone.
Phase 2: The Optimization Grind (Months 3-4)
Your first reviews trickle in. You’re killing bad PPC keywords, scaling winners, and tweaking your listing copy. ACoS drops to 25-40%. You might break even here. Most sellers who quit do it in this phase because they expected profit by now.
Phase 3: Organic Lift (Months 5-8)
This is where the math changes. Organic sales climb as Amazon’s algorithm rewards your consistent sales history. PPC becomes supplementary, not primary. Your margins widen. If you launched a second product in month 4, it starts contributing here.
Phase 4: Scale or Coast (Months 9-12)
You have enough data to know if this product is a winner. Winners get inventory scaled up and potentially expanded variations. Losers get liquidated. Q4 (October-December) typically adds 30-80% to baseline revenue if you’re in a giftable category.
The Numbers Behind Year-One FBA Revenue
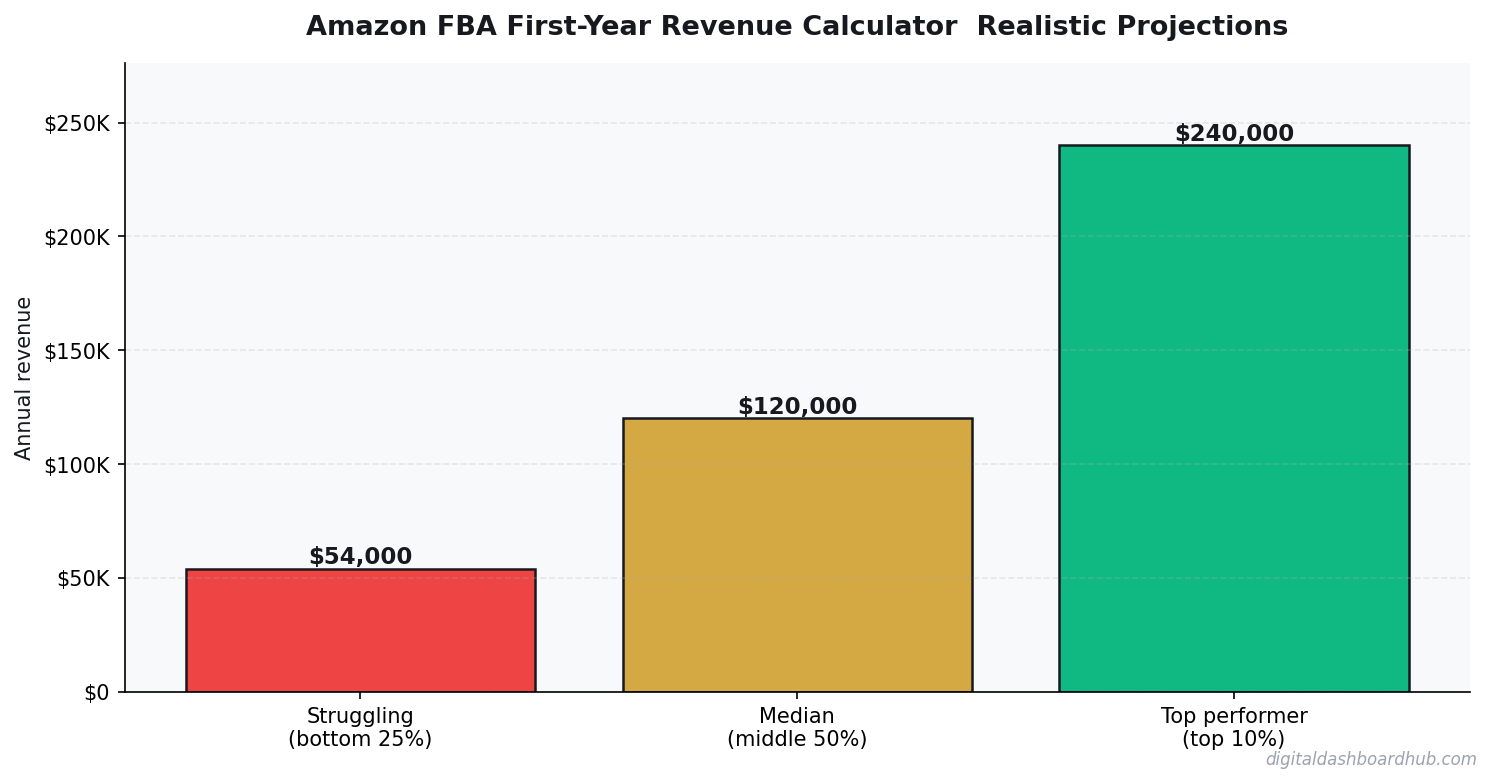
After analyzing hundreds of seller case studies and my own product launches, here are the realistic ranges for total first-year revenue (single product):
These assume a single product in the $25-40 price range with 30-40% gross margins before PPC. Two products doubles the potential but also doubles the complexity and capital requirement.
Seasonal Factors That Wreck Projections
January and February are dead for most categories. If you launch in January expecting strong month-one numbers, you’ll be disappointed. Q4 inflates everything. If your first 12 months include two Q4 periods (launch in October), your numbers look artificially great.
The calculator accounts for this. It applies seasonal multipliers based on your product category so you’re not comparing your January launch to someone’s Q4 highlight reel.
Want the full FBA financial model spreadsheet? Sign up for the free trial and get access to the Amazon FBA Revenue Calculator plus 160+ other business calculators. The tool lets you input your specific product cost, price point, and category to model all 12 months.
What Separates Sellers Who Hit $100K Year One
It’s not secrets. It’s execution speed. Sellers who hit six figures in year one typically launch their second product by month 3-4, reinvest 100% of profit until month 6, and treat PPC optimization as a weekly task — not a monthly afterthought. They also pick products with at least $50,000/month in category revenue and fewer than 300 reviews on the top 5 listings.
Your Next Move
- Model your first year: Start your free trial and run your specific product numbers through the FBA Revenue Calculator. Get month-by-month projections, not vague estimates.
- Set your PPC budget: Plan for $1,000-$2,500 in launch PPC spend. If that number makes you flinch, you’re undercapitalized for FBA.
- Pick your launch window: March-May or August-September give you the best ramp into Q4. Avoid January launches unless your product is fitness-related.
Over 400 sellers have used this calculator to set realistic expectations before investing. Start your free trial — no credit card needed — and see what your first year actually looks like.
A Real First-Year FBA Scenario (With Actual Numbers)
Let me walk through what a realistic first-year looks like for a private-label seller in the kitchen niche. Starting budget: $8,000. Product unit cost from supplier: $4.20. Selling price: $24.99. FBA fees: ~$5.80 per unit. That leaves roughly $15 in gross margin before advertising.
Month 1-2: sourcing, listing setup, PPC learning curve. Revenue: $0. Ad spend: $600. You’re already down $600 before you sell a unit. This is normal and almost nobody talks about it upfront.
Month 3-6: First inventory batch (500 units). If you sell 8 units/day at $24.99, that’s about $5,997/mo gross. After fees, ads (~18% ACoS), and refunds, net is closer to $1,800-$2,100/mo. Not bad for month 4.
Month 7-12: Reorder cycles start compressing cash flow. Inventory sitting in FBA costs money. The sellers who fail here aren’t failing on revenue — they’re failing on cash timing. You sell out, reorder takes 6 weeks, and you lose momentum plus ranking.
The 3 Numbers That Actually Drive FBA Revenue
1. ACoS (Advertising Cost of Sale)
If your ACoS is above 25% in year one, your margins evaporate. Most beginners run 35-45% ACoS because they’re still learning which keywords convert. Budget for it. A 20% ACoS on a 60% gross-margin product is fine. A 40% ACoS on a 35% gross-margin product is a slow bleed.
2. Sell-Through Rate
Amazon charges long-term storage fees after 365 days (and quarterly fees for slow movers). A product that sells 15 units/day is 10x more FBA-friendly than one that sells 1 unit/day, even if the margins look identical on paper. Velocity matters for ranking and for avoiding storage penalties.
3. Return Rate by Category
Electronics: 15-25% return rate. Kitchen: 8-12%. Books and media: under 3%. Your calculator should factor in your category’s return rate — it hits revenue harder than most sellers expect. A 15% return rate on a $30 product running $5,000/mo in revenue quietly eats $750 in gross sales before you’ve accounted for it.
Keep reading (related guides):
- Amazon FBA Revenue Calculator: What Sellers Actually Make in 2026
- How to Start an Amazon FBA Business: Month-by-Month Revenue Expectations
- Amazon FBA Fees Breakdown: Referral, FBA, Storage, PPC — Where Your Money Actually Goes
- How Much Money Amazon FBA Sellers Actually Make (2026 Data)
- Small Business Finance Basics: The Only 5 Numbers You Need to Track Weekly
255+ interactive tools for your money, time, and health.
Full dashboard access · Stripe-secure checkout · Cancel anytime
Keep Reading
- Side Hustle Tax Trap: Track Every Dollar
- Side Hustle Income & Tax Tracker (Free Tool)
- Freelancer Finance Dashboard
Common Questions About Amazon FBA First-Year Revenue Calculator: Realistic Projections
How long does it take to see results?
Most people see meaningful progress within 30-90 days when they apply these strategies consistently. The key is tracking your numbers from day one so you have a baseline to measure against.
What’s the biggest mistake people make?
Trying to do everything at once. Pick one or two strategies from this guide, implement them fully, then layer in additional tactics. Spreading yourself thin is the fastest way to see no results from any of it.
Do I need special tools or software?
Not necessarily to start — but the right tools eliminate hours of manual work. Our free calculators and trackers at Digital Dashboard Hub are a good starting point before you invest in paid software.
Andy Gaber is the founder of Digital Dashboard Hub, a suite of 255+ interactive financial, productivity, and wellness tools. He built DDH after getting frustrated with financial apps that gave outputs without context. Follow along for tool tutorials, revenue analytics breakdowns, and honest takes on personal finance.