
Amazon Takes More of Your Revenue Than You Think
I launched Digital Dashboard Hub because the tools I found online were either too generic or too complicated. Here’s the honest breakdown:
You found a product on Alibaba for $4, you can sell it for $25 on Amazon, and you’re already calculating $21 profit per unit. Except Amazon’s fee structure is designed to eat margins in ways you won’t see until your first monthly statement arrives. Referral fees, FBA fees, storage fees, PPC costs, returns — by the time Amazon is done, that $21 “profit” is often $3-$6. Sometimes less.
I’ve watched friends launch FBA businesses expecting 50% margins and end up at 12%. The math isn’t hard, but you have to know which numbers to include. Most “guru” courses conveniently leave out half of them.
The Real Fee Stack on a $25 Product
28% margin on a good day. And this assumes your PPC is optimized, your return rate stays at 5%, and you don’t hit Q4 storage surcharges (which can 3-5x your storage costs from October to January).
seller-income-distribution”>2026 FBA Seller Income Distribution
Amazon doesn’t publish seller income data, but multiple surveys (Jungle Scout’s annual report, Helium 10 seller surveys, and r/FulfillmentByAmazon community data) paint a consistent picture:
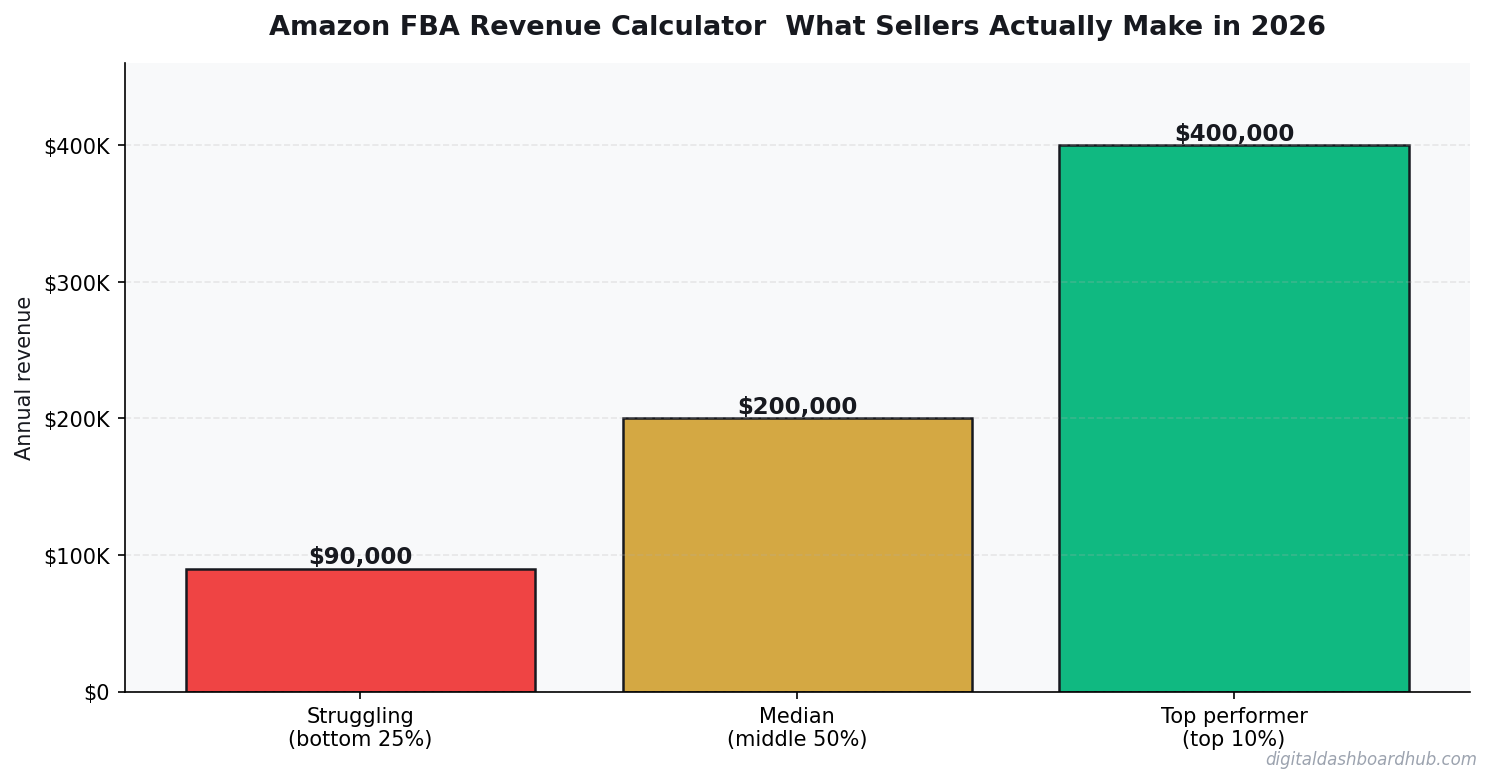
40% of FBA sellers are either losing money or barely making anything. That’s not a failure rate you hear in course ads, but it’s reality. The barrier to entry is low; the barrier to profitability is not.
The Hidden Costs That Kill Margins
PPC Is Now Table Stakes
In 2020, you could launch a product and get organic sales. In 2026, you’re invisible without PPC. Average cost-per-click in competitive categories is $1.20-$2.50. If your conversion rate is 10%, that’s $12-$25 in ad spend per sale. On a $25 product, PPC alone can eat 48-100% of your gross margin. You have to be surgical with keywords or you’ll bleed money.
Storage Fees Are Getting Worse
Amazon raised storage fees again in 2025, and aged inventory surcharges now kick in at 180 days (it used to be 365). If a product sits for 6+ months, you’re paying $6.90 per cubic foot per month on top of regular storage. Slow-moving inventory doesn’t just not make money — it actively costs money.
Returns Are a Profit Black Hole
Amazon’s return policy is generous — to customers. For sellers, a return means: you refund the customer, Amazon keeps their referral fee (partially), the item often can’t be resold as new, and you eat the return shipping. A 10% return rate on a low-margin product can make the entire SKU unprofitable.
Before you source your next product, run it through a real margin calculator. The Digital Dashboard Hub FBA calculator breaks down every Amazon fee, estimates PPC costs by category, and shows your actual per-unit profit. It’s the difference between guessing you’ll make money and knowing.
What Profitable FBA Sellers Do Differently
- They target 40%+ gross margins before PPC. If your margin is already thin before advertising, you have no room for error. Aim for products where COGS + Amazon fees are under 60% of the sale price.
- They sell at $30-$70 price points. Below $20, fees eat too much. Above $75, conversion rates drop and returns increase. The sweet spot is $35-$50 for most categories.
- They track ACoS religiously. Advertising Cost of Sale (ad spend / ad revenue) should stay under 25%. Above 30% for more than 2 weeks? Kill the campaign or rework the keywords.
- They launch with 3-5 SKUs, not 1. Spreading risk across multiple products means one dud doesn’t kill the business.
Try This Today
- Right now: Calculate your true per-unit margin on your best-selling product. Include every fee from the table above. If it’s under 20%, you have a pricing or sourcing problem.
- This week: Run 3 potential product ideas through an FBA revenue calculator before contacting any suppliers. Kill bad ideas with math before they cost you money.
- Long game: Build toward a portfolio of 5-10 SKUs with 30%+ net margins. Diversification is the only defense against Amazon changing fees or a competitor crashing your listing.
Over 600 Amazon sellers have used our FBA calculators to stress-test product ideas before ordering inventory. The calculator doesn’t care about your excitement — it just shows margins. Run your numbers for free.
What the Top 10% of Amazon FBA Sellers Actually Make
The median FBA seller doing $10K-$50K/month in gross revenue takes home about 15-22% as net profit after all costs. That’s $1,500-$11,000/mo. Sounds like a wide range — but it comes down almost entirely to product selection and ACoS control.
The top decile — sellers clearing $100K+/mo gross — typically run a tighter ship: 25-35% net margins, multiple SKUs, and often a retail arbitrage or wholesale component layered on top of private label. They’re not smarter. They sourced better products and learned to kill losing SKUs fast.
The Math Behind a $5,000/Month Seller
Here’s what a realistic mid-tier seller’s P&L looks like monthly:
- Gross revenue: $18,500
- COGS (product + shipping to FBA): $5,920 (32%)
- Amazon fees (referral + FBA): $4,070 (22%)
- PPC advertising: $2,775 (15% ACoS)
- Returns/chargebacks: $555 (3%)
- Net profit: ~$5,180/mo
That’s a 28% net margin — achievable but not easy. The sellers bleeding money are usually running 25-35% ACoS, which compresses that number to near zero.
The 2 Factors That Move FBA Revenue Most
Product-Market Fit, Not Sourcing Cost
Saving $0.50/unit on COGS matters. Picking a product with 3x organic demand matters 10x more. I’ve watched sellers obsess over supplier negotiations while running ads on a product nobody searches for. Get the demand validation right first, then optimize cost.
Review Velocity in the First 60 Days
Amazon’s algorithm heavily weights conversion rate in early ranking decisions. A product with 50 reviews converting at 18% will outrank a product with 5 reviews converting at 25% — even though the second product is “better.” Your launch strategy (Vine, follow-up sequences, pricing) in the first 60 days determines your organic rank for months. Underinvesting here is the most expensive mistake new FBA sellers make.
Keep reading (related guides):
255+ interactive tools for your money, time, and health.
Full dashboard access · Stripe-secure checkout · Cancel anytime
Keep Reading
- Side Hustle Tax Trap: Track Every Dollar
- Freelancer Finance Dashboard: Track Income, Taxes, and Cash Flow
- Side Hustle Income Tax Tracker (Free Tool)
Common Questions About Amazon FBA Revenue Calculator: What Sellers Actually Make in 2026
How long does it take to see results?
Most people see meaningful progress within 30-90 days when they apply these strategies consistently. The key is tracking your numbers from day one so you have a baseline to measure against.
What’s the biggest mistake people make?
Trying to do everything at once. Pick one or two strategies from this guide, implement them fully, then layer in additional tactics. Spreading yourself thin is the fastest way to see no results from any of it.
Do I need special tools or software?
Not necessarily to start — but the right tools eliminate hours of manual work. Our free calculators and trackers at Digital Dashboard Hub are a good starting point before you invest in paid software.
Andy Gaber is the founder of Digital Dashboard Hub, a suite of 255+ interactive financial, productivity, and wellness tools. He built DDH after getting frustrated with financial apps that gave outputs without context. Follow along for tool tutorials, revenue analytics breakdowns, and honest takes on personal finance.