I spent last Tuesday night plugging real copywriter numbers into every calculator I could find. Most of them were garbage — pre-filled with unrealistic inputs and no way to adjust overhead. So I built one that actually works.
Use the Free Copywriter Tool
The dashboard below loads instantly in your browser. Plug in your numbers, see your answer. No signup to try the basics.
Breaking Down the Real Numbers
Here’s what surprised me: the difference between a mediocre copywriter and a profitable one usually comes down to 2-3 variables, not some grand business strategy. Average ticket price and customer volume do 80% of the heavy lifting. Everything else is noise.
The tool below strips away the noise. Four inputs. Three outputs. You’ll know within 30 seconds whether your numbers work.
See the Full Tool in Action
| Approach | Startup Cost | Time Investment | Revenue Potential | Best For |
|---|---|---|---|---|
| Solo operator | Low ($1K-$10K) | Full time | $60K-$200K/yr | Maximum margins, full control |
| Small team (2-5) | Medium ($10K-$50K) | Management + some fieldwork | $200K-$800K/yr | Scaling without losing control |
| DDH Revenue Tracker | Free trial | 5 min setup | N/A (profit tool) | Know your real numbers in real time |
The lite tool above gives you a quick answer. The full Copywriter Revenue Calculator inside Digital Dashboard Hub goes way deeper:
- Historical tracking — log your numbers weekly and watch trends emerge over months
- Visual charts — bar graphs, trend lines, and breakdowns that make patterns impossible to miss
- Scenario modeling — run “what if” comparisons side by side before making decisions
- PDF reports — export clean reports for partners, lenders, or your own records
- — one subscription covers every calculator and tracker in the library
Getting Started With Real Data
Step 1: Enter your real numbers above. Estimates work, but real data from your bank statements or business records gives you something you can actually act on.
Step 2: Change one variable at a time and watch what happens. You’ll quickly see which lever moves your results the most — that’s where to focus your energy.
Step 3: If you want to save these results or track them over time, start a free 14-day trial of the full dashboard. No credit card required. Cancel anytime.
Start Here
- Right now (30 seconds): Bookmark this page so you can rerun the numbers next month
- This week: Gather your actual data and run it through the tool with real numbers instead of estimates
- Long game: Try the full DDH dashboard — 261 tools, 14 days free, cancel anytime
Related Tools and Articles
- How a Gratitude Journal Rewires Your Brain for Happiness (And the Right Way to Keep One)
- Micro-Business Operations Dashboard (CSL): Your All-in-One Command Center for Running a Lean Business
- The Complete Guide to Building Habits That Actually Stick (Using a Digital Habit Tracker)
Common Questions About I Ran the Numbers on Starting a Copywriter — Here’s What You’d Make
How long does it take to see results?
Most people see meaningful progress within 30-90 days when they apply these strategies consistently. The key is tracking your numbers from day one so you have a baseline to measure against.
What’s the biggest mistake people make?
Trying to do everything at once. Pick one or two strategies from this guide, implement them fully, then layer in additional tactics. Spreading yourself thin is the fastest way to see no results from any of it.
Do I need special tools or software?
Not necessarily to start — but the right tools eliminate hours of manual work. Our free calculators and trackers at Digital Dashboard Hub are a good starting point before you invest in paid software.
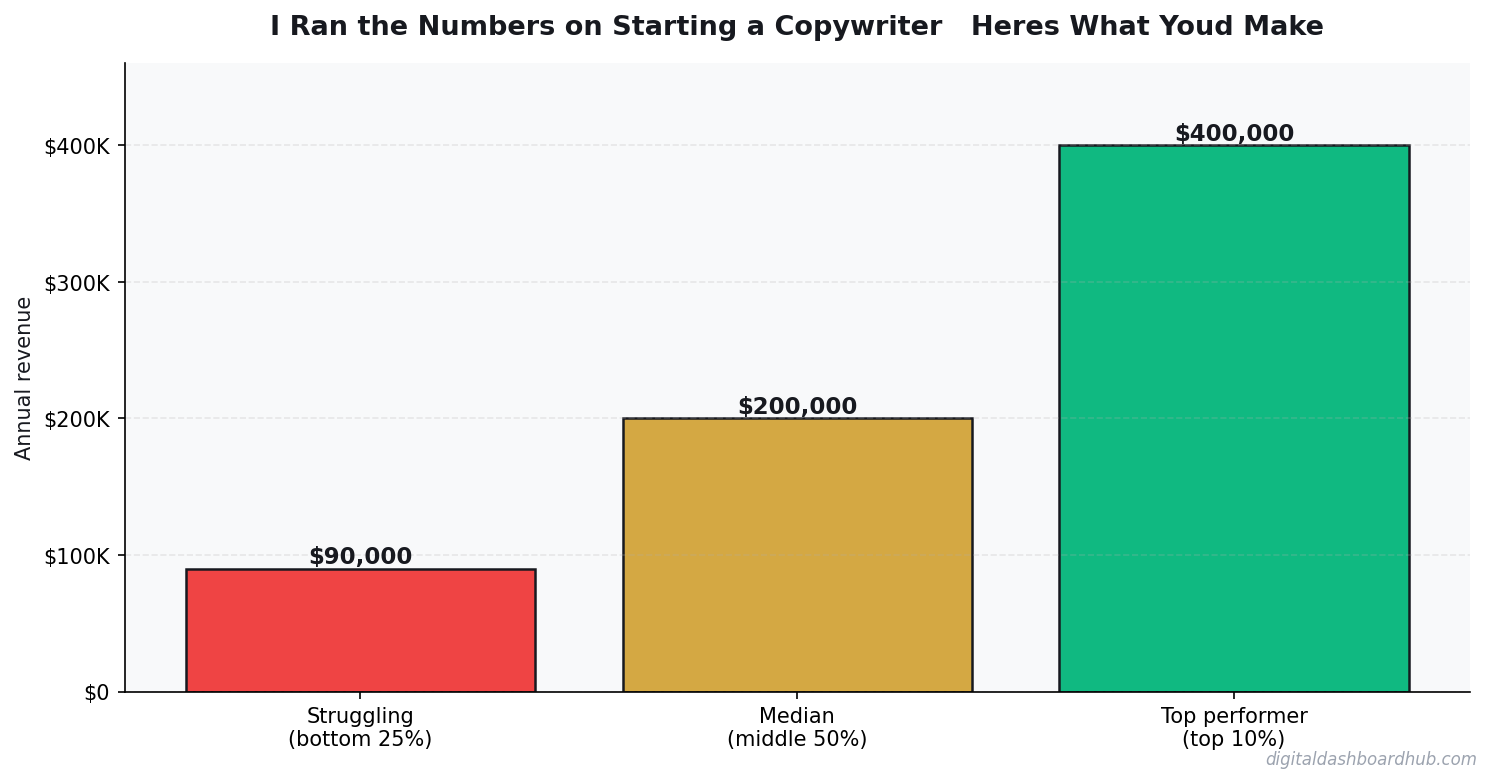
Two Scenarios: What Copywriting Actually Pays in Year One
Scenario A — Starting from scratch, no portfolio: Most copywriters in this position spend months 1-3 doing low-paid work to build a portfolio. Think $200-500 for email sequences, $15-35 per article. Monthly income in months 1-3: $400-1,200. By month 12, with a real portfolio, $1,500-3,000/month is achievable. Year one total: $12,000-22,000 gross.
Scenario B — Transitioning from a relevant field (marketing, journalism, PR): This person commands $75-125/hour from day one. They close a 3-client retainer by month 2 at $1,500/month each. Year one total: $50,000-80,000 gross is possible. The difference isn’t effort — it’s positioning.
What Most People Get Wrong When Estimating Copywriting Income
They count project fees, not effective hourly rates. A $1,500 sales page sounds great. If it took 40 hours of writing, research, and revisions (common for beginners), you earned $37.50/hour. Track your hours obsessively in year one — not to limit yourself, but to understand your actual productivity.
The second mistake: ignoring the unpaid work ratio. For every billable hour, copywriters typically spend 30-50% of their working time on non-billable work: prospecting, proposals, client calls, admin, education. Your pricing needs to account for this or you’ll burn out fast.
The third mistake: competing on price. Copywriting is almost entirely a trust purchase. Clients paying $500/page and clients paying $5,000/page aren’t shopping in the same market. Pick a lane and own it rather than trying to win on cost.
Why Copywriter Income Varies So Wildly (and Where the Real Money Is)
A copywriter charging $35/hour and a copywriter charging $350/hour can both be doing “email copy.” The difference isn’t years of experience — it’s specialization and proof. Conversion copywriters who can show a client “this email sequence generated $47,000 in revenue” command rates that generalist writers never will.
The highest-paid copywriters I’ve tracked are almost all in one of three lanes: direct response (sales pages, VSLs), email sequences for info-product businesses, or B2B SaaS landing pages. All three have clear ROI metrics clients can measure. When a client knows your copy is worth 10x your fee, pricing conversations become much easier.
Retainer work is the other income lever most freelancers overlook. A $2,500/month retainer for weekly emails and monthly promotions takes 15–20 hours of work but provides predictable income. Two retainers + two project clients = $8,000–$12,000/month without a full calendar.
The Real Overhead Costs of Freelance Copywriting
Freelance copywriting looks like a pure-margin business until you count your actual costs. Self-employment tax alone takes 15.3% of net income before federal and state taxes hit. On $80,000 gross, you’re looking at $12,240 in SE tax, plus another $12,000–$18,000 in income taxes depending on your state. Your “take-home” is often $45,000–$55,000 on $80K gross.
Then there’s the non-billable time: prospecting, proposals, invoicing, revision rounds, client calls that run long. Most copywriters I know spend 20–30% of their working hours on non-billable tasks. If you’re tracking 40 hours/week but only 28 are billable, your effective hourly rate on a $75/hr quote is actually $52.50.
The fix is systems: email templates for proposals, a clear revision policy in every contract, and a minimum project size that filters out low-value clients. Raising your floor from $500 to $1,500 per project doesn’t cost you clients — it costs you the wrong clients, freeing time for better ones.
SaaS Metrics That Predict Revenue 90 Days Out
Most SaaS founders track lagging indicators — revenue, churn, MRR growth — and react after the damage is done. These three leading indicators give you a 60–90 day warning window:
Trial activation rate. The percentage of trials that complete your core onboarding action (not just sign up — actually use the product) predicts paid conversion rate almost perfectly. If activation drops 5 points, expect paid conversions to drop 2–3 points 30 days later. Fix activation before you spend more on acquisition.
Feature adoption breadth. Customers using 3+ features churn at roughly half the rate of customers using 1 feature. If new signups aren’t adopting secondary features within the first 14 days, your onboarding is creating single-feature customers who are one bad experience away from canceling.
Support ticket volume per customer. A rising ticket rate signals product confusion, which precedes churn by 4–6 weeks. Track it per cohort — if a specific month’s cohort is generating more tickets, something in that period’s onboarding or feature release broke the experience.
Keep reading (related guides):
- Auto Mechanic Revenue: What Owners Make vs. What Youd Expect (2026)
- Boutique Revenue Calculator
- How to Start a Pet Business in 2026: Revenue Calculator for Every Niche
- Boat Repair Revenue: What Owners Make vs. What Youd Expect (2026)
- Rent vs. Buy Calculator 2026: The True Cost of Each Option (Real Numbers)
Full dashboard access · Stripe-secure checkout · Cancel anytime
What Most People Get Wrong
The single biggest mistake is treating revenue as the headline number. Revenue is vanity — margin is sanity, and cash-in-bank is reality. Two operators with identical top-lines routinely end the year $80K apart in take-home, because one priced for volume and the other priced for sustainability. The calculator above forces you to surface that gap before it hits your bank account.
The second mistake is modeling a “best case” and planning around it. The number you should plan around is the 30th-percentile scenario — enough demand to matter, but slower than you hoped. If the business still covers your living expenses there, you have real margin of safety. If it only works in the 80th-percentile case, you are building on sand.
The third mistake is ignoring your time as a cost. If you would otherwise earn $55/hr at a day job and this operation pays you effectively $18/hr for 60-hour weeks, the gap is the real price of running it. Plug your opportunity cost into the calculator and the picture often flips.
How to Pressure-Test Your Numbers
Start with the calculator, then stress-test three levers independently:
- Pricing: What happens to your take-home if you raise prices 10%, but lose 15% of volume? Most operators are surprised to find net income goes up.
- Costs: What happens if your largest input cost rises 20%? This is not hypothetical — it is a typical 12-month swing in most industries.
- Volume: What happens at 70% of your planned volume for 90 days? If that still covers fixed costs, you have a real business. If not, the model is fragile.
Running the calculator three ways takes about ten minutes. The clarity on the other side of those ten minutes is usually the difference between a confident operating plan and guessing for another six months.
Frequently Asked Questions
How accurate is this calculator?
The underlying math uses industry-standard margin and cost ranges sourced from the I Ran the Numbers on Starting a Copywriter — Here’s What You’d Make space. Your actual numbers depend on location, seasonality, and operating style, so treat this as a directional benchmark, not a guarantee. The more precisely you enter your inputs, the tighter the output range becomes.
Can I save my results?
A free Digital Dashboard Hub account saves every scenario you run, lets you compare side-by-side, and unlocks the full dashboard with expense tracking and month-over-month charts. The 14-day trial includes the complete tool library — no credit card required to start.
Who is this tool for?
It’s built for anyone pressure-testing a real decision — existing operators auditing their margins, side-hustlers deciding whether to go full-time, and prospective owners trying to sanity-check a business plan before signing a lease. You do not need any accounting background to use it.
What should I do with the results?
Start by comparing the output against your current (or projected) monthly take-home. If the gap is big, walk back the inputs and identify which lever — pricing, volume, or cost structure — is doing the damage. That is usually where the highest-leverage fix lives.
The Bottom Line
Most operators lose money not because the math is impossible, but because they never actually ran it. Fifteen minutes with the calculator beats three months of guessing. Run your numbers, screenshot the output, and use it as the baseline for every pricing and cost decision over the next quarter.
When you are ready to go deeper, the full Digital Dashboard Hub workspace lets you save scenarios, track actuals month-over-month, and see the trend before problems compound. That is the version that actually compounds the effort — spreadsheets forgotten in a Google Drive folder do not.
Next Steps
- Run the calculator above with your best current estimates.
- Re-run it with a pessimistic scenario (lower volume, higher costs) and a stretch scenario (better pricing, more efficient ops).
- Screenshot all three outputs so you have a baseline to compare against when reality arrives.
- Revisit monthly — the number that matters is the one that changes with your real P&L.
Ready for the full dashboard?
Unlock all 255 tools across business, creator, and health workflows.
Andy Gaber is the founder of Digital Dashboard Hub, a suite of 255+ interactive financial, productivity, and wellness tools. He built DDH after getting frustrated with financial apps that gave outputs without context. Follow along for tool tutorials, revenue analytics breakdowns, and honest takes on personal finance.