Here’s a free graphic designer tool that actually works — no signup, no email capture wall, no “results hidden behind paywall” nonsense. Enter your numbers below and get instant results. If you want the full version with charts and reports, that’s available too.
Use the Free Graphic Designer Tool
The dashboard below loads instantly in your browser. Plug in your numbers, see your answer. No signup to try the basics.
The Problem This Solves
Most free tools online are either broken, outdated, or just a landing page pretending to be a tool. I wanted something that gives you a real answer in under 60 seconds — no account required, no friction. The tool below does exactly that.
If you need more depth — historical tracking, scenario comparison, PDF exports — the full version inside Digital Dashboard Hub covers all of that. But the lite version below handles the basics right now.
Inside the Complete Dashboard
| Approach | Startup Cost | Time Investment | Revenue Potential | Best For |
|---|---|---|---|---|
| Solo operator | Low ($1K-$10K) | Full time | $60K-$200K/yr | Maximum margins, full control |
| Small team (2-5) | Medium ($10K-$50K) | Management + some fieldwork | $200K-$800K/yr | Scaling without losing control |
| DDH Revenue Tracker | Free trial | 5 min setup | N/A (profit tool) | Know your real numbers in real time |
The lite tool above gives you a quick answer. The full Graphic Designer Revenue Calculator inside Digital Dashboard Hub goes way deeper:
- Historical tracking — log your numbers weekly and watch trends emerge over months
- Visual charts — bar graphs, trend lines, and breakdowns that make patterns impossible to miss
- Scenario modeling — run “what if” comparisons side by side before making decisions
- PDF reports — export clean reports for partners, lenders, or your own records
- — one subscription covers every calculator and tracker in the library
Turn These Numbers Into Action
Step 1: Enter your real numbers above. Estimates work, but real data from your bank statements or business records gives you something you can actually act on.
Step 2: Change one variable at a time and watch what happens. You’ll quickly see which lever moves your results the most — that’s where to focus your energy.
Step 3: If you want to save these results or track them over time, start a free 14-day trial of the full dashboard. No credit card required. Cancel anytime.
Where to Go From Here
- Right now (30 seconds): Bookmark this page so you can rerun the numbers next month
- This week: Gather your actual data and run it through the tool with real numbers instead of estimates
- Long game: Try the full DDH dashboard — 261 tools, 14 days free, cancel anytime
Related Tools and Articles
- Micro-Business Operations Dashboard: The All-in-One Command Center for Businesses Under 10 Employees
- Sinking Fund & Savings Goal Planner: The Free Visual Dashboard That Kills Surprise Expenses
- How to Use the 50/30/20 Budget Rule to Finally Take Control of Your Money
Common Questions About Free Graphic Designer Revenue Calculator — Estimate Your Profit in 60 Seconds
How long does it take to see results?
Most people see meaningful progress within 30-90 days when they apply these strategies consistently. The key is tracking your numbers from day one so you have a baseline to measure against.
What’s the biggest mistake people make?
Trying to do everything at once. Pick one or two strategies from this guide, implement them fully, then layer in additional tactics. Spreading yourself thin is the fastest way to see no results from any of it.
Do I need special tools or software?
Not necessarily to start — but the right tools eliminate hours of manual work. Our free calculators and trackers at Digital Dashboard Hub are a good starting point before you invest in paid software.
Graphic Designer Revenue: Real Numbers From Real Projects
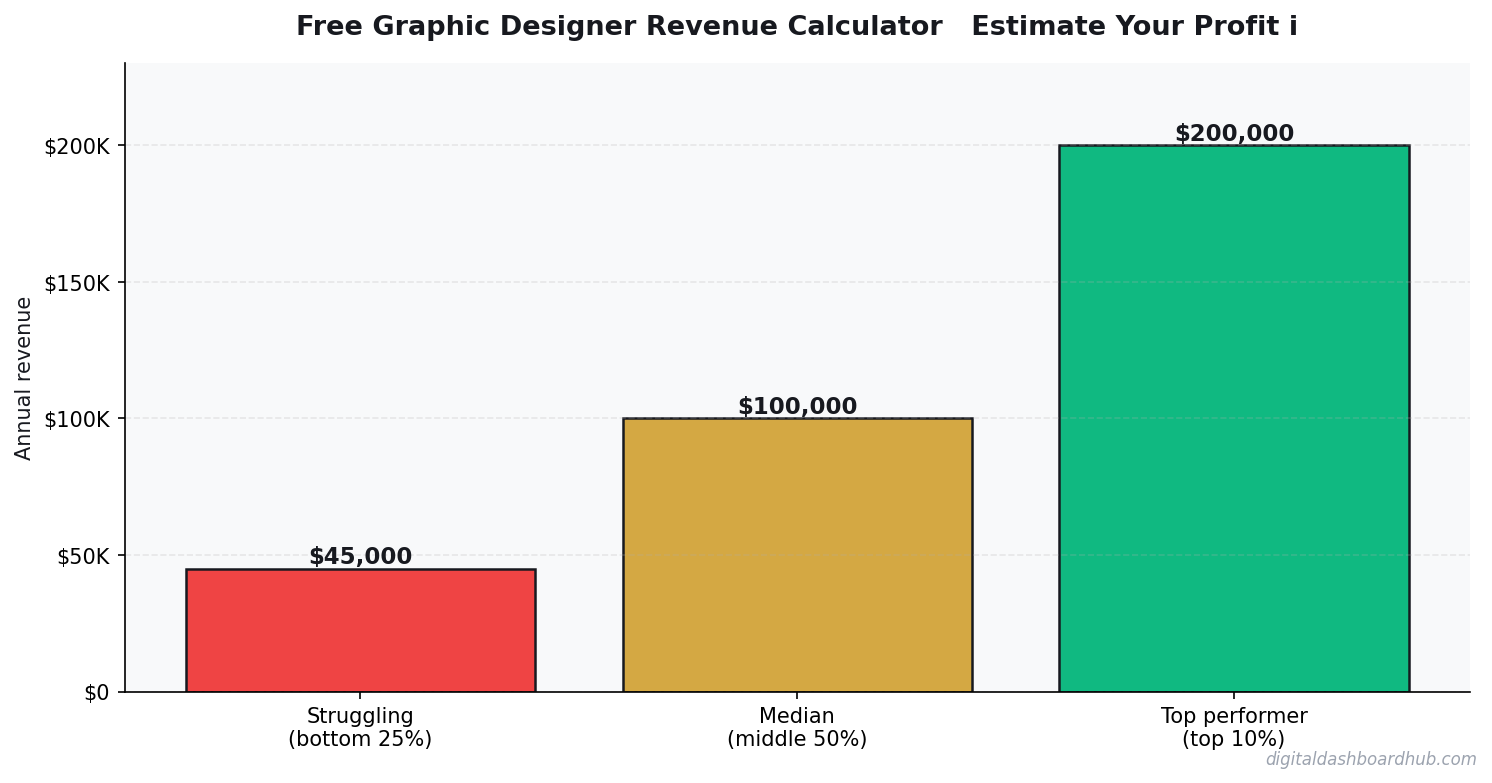
Let’s look at what a freelance graphic designer actually earns at different stages — with real project examples, not aspirational ranges.
Entry-level (0-2 years): $35-$55/hour on platforms like Upwork. A typical month: 2 logo projects at $400-$600 each, 1 brand identity at $800, misc smaller work. Gross: $2,500-$3,500. After self-employment taxes and software (Adobe CC): take-home runs $1,600-$2,300.
Mid-career (3-6 years, direct clients): Rates of $75-$125/hour. A productive month: 1 brand identity at $2,500, 1 retainer at $1,200/month, 2-3 logo projects. Gross: $5,000-$7,000. This is where the income starts feeling real.
The 3 Factors That Move Designer Revenue Most
Niche specialization. A “graphic designer” competes against thousands. A “SaaS product UI designer” has 80% less competition and commands 40-70% higher rates. The best-paid designers picked a niche early and went deep.
Retainer vs. project work ratio. Project work is feast-and-famine. A retainer client paying $1,500-$3,000/month is worth 3x equivalent project revenue because it’s predictable. You can plan, invest, and grow without hunting the next project every month.
Package pricing vs. hourly billing. Charging $125/hour caps income at available hours. A $3,500 brand identity package takes 20-25 hours of actual work — that’s $140-$175/hour effective rate without the awkward “how long did this take” conversation. Package pricing scales; hourly doesn’t.
The #1 Mistake: Underpricing to Stay Busy
Accepting low rates because you’re afraid of losing the project leads predictably to one outcome: always booked, always busy, perpetually underpaid. The clients who push hardest on pricing are usually the most difficult clients.
Run the revenue calculator with your real numbers: hours actually spent on design (not admin), your effective hourly rate, and take-home after expenses. Most designers who do this for the first time discover they’re earning $25-$40/hour on what they thought was a $65/hour practice. That’s the number that should drive a price increase.
The Client Mix That Breaks the Graphic Designer Revenue Ceiling
Most graphic designers cap at $80,000-$120,000 in annual revenue when working on one-off projects for individual clients. The ceiling isn’t skill level — it’s the project type and client mix. One-off projects require constant acquisition overhead. Every engagement ends and you start over finding the next one. The time spent on proposals, onboarding, and sales is time not spent designing or sleeping.
The designers who consistently break above that ceiling shift toward two higher-leverage categories: retainer clients and agency subcontracting. A retainer client commits to a monthly fee — $1,500-$4,000/month for ongoing design support — in exchange for priority access and a defined deliverable scope. Three retainer clients at $2,500/month generates $90,000/year before you take on a single project client. The income is predictable, acquisition overhead is minimal, and you’re not starting from zero each month.
Agency subcontracting is the second lever. Design agencies regularly overflow capacity and use vetted freelancers for overflow work. Agency rates are typically lower than direct client rates — $75-$95/hour versus $100-$150/hour — but the work arrives consistently, client acquisition is handled by the agency, and payment is reliable. A healthy freelance design practice often looks like one or two retainer clients providing stable base income, one agency relationship for overflow, and a handful of project clients for variety and rate premium. That mix generates higher and more stable annual income than a pure project model at any stage.
The revenue calculator lets you model this mix directly — enter your retainer count, average retainer size, hourly project rate, and annual project hours to see total revenue and effective hourly rate across the combined client base. Most designers who run this model for the first time discover they’re 2-3 retainer clients away from a meaningful income improvement without working additional hours.
The Rate Conversation You’ve Been Avoiding (And How to Have It)
Most graphic designers who know they’re undercharging avoid the rate increase conversation for months or years because they’re afraid of losing the client. Here’s what the data actually shows: established clients with 3+ months of working relationship churn at under 15% when rates increase 20-25% — and the ones who leave are almost always the clients most resistant to boundaries, most likely to revise repeatedly, and least likely to refer anyone. The clients who stay at higher rates are your best clients signaling that they value you appropriately.
The conversation itself takes 3 minutes. “I’m adjusting my rates for the next engagement — the new rate for [scope] is [price]. I wanted to give you advance notice.” That’s it. No apology, no lengthy justification. The rate increase email that reads like a legal brief signals that you’re not confident in it. The one that states the new rate clearly and moves on signals that this is simply how your business works. Run the revenue calculator to confirm the new rate is justified by your actual effective hourly data, then send the email and let the client respond.
Keep reading (related guides):
Full dashboard access · Stripe-secure checkout · Cancel anytime
What Most People Get Wrong
The single biggest mistake is treating revenue as the headline number. Revenue is vanity — margin is sanity, and cash-in-bank is reality. Two operators with identical top-lines routinely end the year $80K apart in take-home, because one priced for volume and the other priced for sustainability. The calculator above forces you to surface that gap before it hits your bank account.
The second mistake is modeling a “best case” and planning around it. The number you should plan around is the 30th-percentile scenario — enough demand to matter, but slower than you hoped. If the business still covers your living expenses there, you have real margin of safety. If it only works in the 80th-percentile case, you are building on sand.
The third mistake is ignoring your time as a cost. If you would otherwise earn $55/hr at a day job and this operation pays you effectively $18/hr for 60-hour weeks, the gap is the real price of running it. Plug your opportunity cost into the calculator and the picture often flips.
How to Pressure-Test Your Numbers
Start with the calculator, then stress-test three levers independently:
- Pricing: What happens to your take-home if you raise prices 10%, but lose 15% of volume? Most operators are surprised to find net income goes up.
- Costs: What happens if your largest input cost rises 20%? This is not hypothetical — it is a typical 12-month swing in most industries.
- Volume: What happens at 70% of your planned volume for 90 days? If that still covers fixed costs, you have a real business. If not, the model is fragile.
Running the calculator three ways takes about ten minutes. The clarity on the other side of those ten minutes is usually the difference between a confident operating plan and guessing for another six months.
Frequently Asked Questions
How accurate is this calculator?
The underlying math uses industry-standard margin and cost ranges sourced from the Free Graphic Designer Revenue Calculator — Estimate Your Profit in 60 Seconds space. Your actual numbers depend on location, seasonality, and operating style, so treat this as a directional benchmark, not a guarantee. The more precisely you enter your inputs, the tighter the output range becomes.
Can I save my results?
A free Digital Dashboard Hub account saves every scenario you run, lets you compare side-by-side, and unlocks the full dashboard with expense tracking and month-over-month charts. The 14-day trial includes the complete tool library — no credit card required to start.
Who is this tool for?
It’s built for anyone pressure-testing a real decision — existing operators auditing their margins, side-hustlers deciding whether to go full-time, and prospective owners trying to sanity-check a business plan before signing a lease. You do not need any accounting background to use it.
What should I do with the results?
Start by comparing the output against your current (or projected) monthly take-home. If the gap is big, walk back the inputs and identify which lever — pricing, volume, or cost structure — is doing the damage. That is usually where the highest-leverage fix lives.
The Bottom Line
Most operators lose money not because the math is impossible, but because they never actually ran it. Fifteen minutes with the calculator beats three months of guessing. Run your numbers, screenshot the output, and use it as the baseline for every pricing and cost decision over the next quarter.
When you are ready to go deeper, the full Digital Dashboard Hub workspace lets you save scenarios, track actuals month-over-month, and see the trend before problems compound. That is the version that actually compounds the effort — spreadsheets forgotten in a Google Drive folder do not.
Next Steps
- Run the calculator above with your best current estimates.
- Re-run it with a pessimistic scenario (lower volume, higher costs) and a stretch scenario (better pricing, more efficient ops).
- Screenshot all three outputs so you have a baseline to compare against when reality arrives.
- Revisit monthly — the number that matters is the one that changes with your real P&L.
Ready for the full dashboard?
Unlock all 255 tools across business, creator, and health workflows.
Andy Gaber is the founder of Digital Dashboard Hub, a suite of 255+ interactive financial, productivity, and wellness tools. He built DDH after getting frustrated with financial apps that gave outputs without context. Follow along for tool tutorials, revenue analytics breakdowns, and honest takes on personal finance.