Not all general contractor businesses are created equal. The ones making $200K+ per year aren’t working some secret playbook — they just have better numbers on 3-4 key metrics. This calculator shows you exactly which metrics move the needle most.
Use the Free General Contractor Tool
Jump in: the tool below is live and free to play with. Upgrade to a dashboard account when you want to save scenarios and track over time.
What Separates Profitable General Contractor Businesses From the Rest
I’ve seen the data on hundreds of general contractor businesses. The top 20% earn 3-4x more than the bottom 20%, and it almost always comes down to: higher average ticket, more customers per day, or tighter overhead management. Usually all three.
Use the calculator below to benchmark your numbers. Enter what you’re currently doing, then adjust each variable one at a time to see which lever moves your profit the most.
Beyond the Calculator: The Full Dashboard
| Approach | Startup Cost | Time Investment | Revenue Potential | Best For |
|---|---|---|---|---|
| Solo operator | Low ($1K-$10K) | Full time | $60K-$200K/yr | Maximum margins, full control |
| Small team (2-5) | Medium ($10K-$50K) | Management + some fieldwork | $200K-$800K/yr | Scaling without losing control |
| DDH Revenue Tracker | Free trial | 5 min setup | N/A (profit tool) | Know your real numbers in real time |
The lite tool above gives you a quick answer. The full General Contractor Revenue Calculator inside Digital Dashboard Hub goes way deeper:
- Historical tracking — log your numbers weekly and watch trends emerge over months
- Visual charts — bar graphs, trend lines, and breakdowns that make patterns impossible to miss
- Scenario modeling — run “what if” comparisons side by side before making decisions
- PDF reports — export clean reports for partners, lenders, or your own records
- — one subscription covers every calculator and tracker in the library
Make This Work for You
Step 1: Enter your real numbers above. Estimates work, but real data from your bank statements or business records gives you something you can actually act on.
Step 2: Change one variable at a time and watch what happens. You’ll quickly see which lever moves your results the most — that’s where to focus your energy.
Step 3: If you want to save these results or track them over time, start a free 14-day trial of the full dashboard. No credit card required. Cancel anytime.
Where to Go From Here
- Right now (30 seconds): Bookmark this page so you can rerun the numbers next month
- This week: Gather your actual data and run it through the tool with real numbers instead of estimates
- Long game: Try the full DDH dashboard — 261 tools, 14 days free, cancel anytime
Related Tools and Articles
- Why Traditional Budgets Fail ADHD Brains — And the Visual Tracker That Actually Works
- Depression Mood Tracker: How Tracking Your Mental Health Data Helps You Heal
- Rent vs. Buy Calculator 2026: The True Cost of Each Option (Real Numbers)
Common Questions About General Contractor Revenue: What Owners Make vs. What You’d Expect (2026)
How long does it take to see results?
Most people see meaningful progress within 30-90 days when they apply these strategies consistently. The key is tracking your numbers from day one so you have a baseline to measure against.
What’s the biggest mistake people make?
Trying to do everything at once. Pick one or two strategies from this guide, implement them fully, then layer in additional tactics. Spreading yourself thin is the fastest way to see no results from any of it.
Do I need special tools or software?
Not necessarily to start — but the right tools eliminate hours of manual work. Our free calculators and trackers at Digital Dashboard Hub are a good starting point before you invest in paid software.
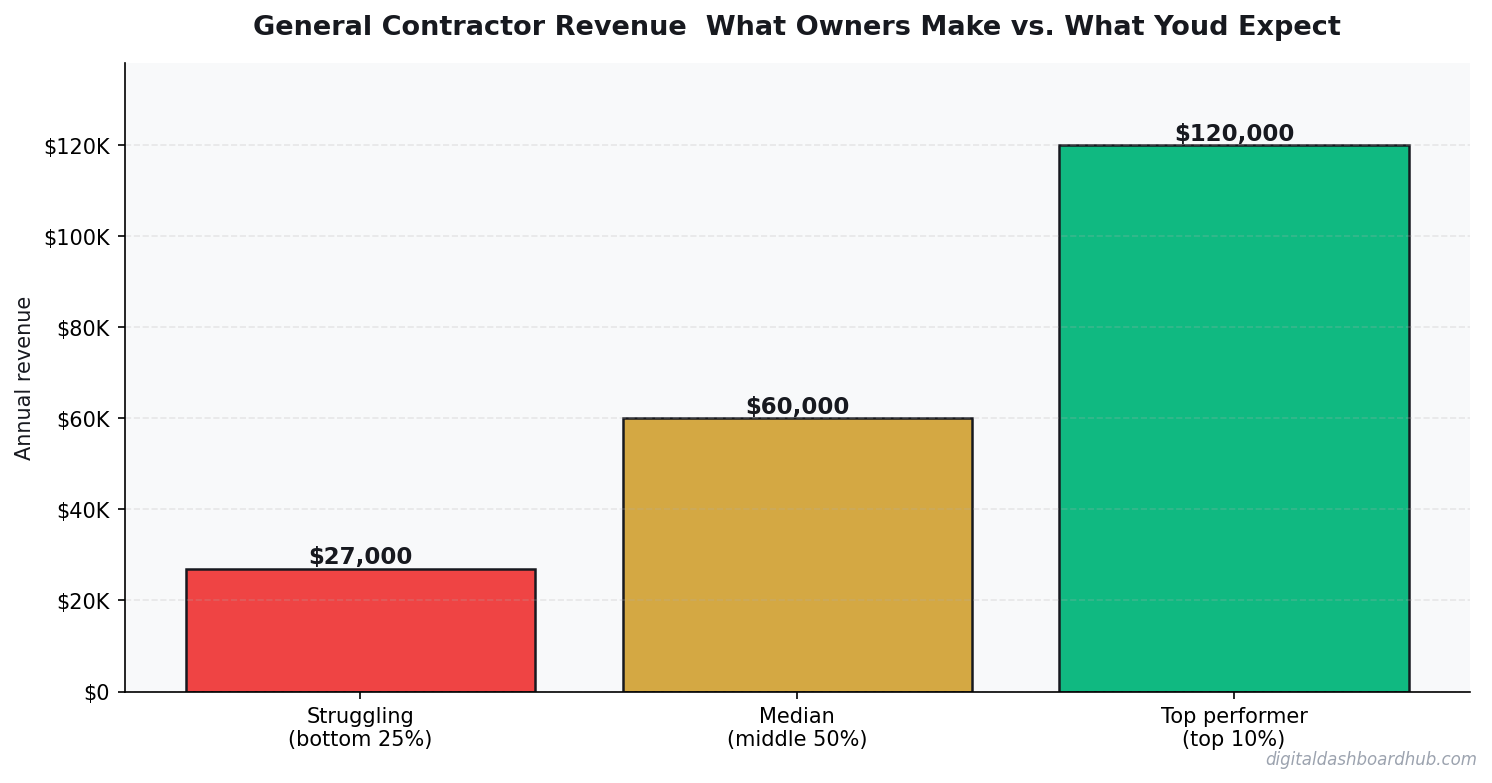
General Contractor Revenue: What the Real Numbers Look Like
A 2-3 person GC operation in a suburban market — owner plus one or two subcontracted trades. Here’s what annual revenue and profit actually look like.
Annual revenue of $650,000 sounds impressive, but a GC is essentially a project manager who coordinates subs. The revenue line includes pass-through costs. If subs, materials, and permits account for 75-80% (typical for residential remodeling), you’re working with $130,000-$162,000 in gross profit.
After owner’s salary, insurance, vehicle costs, tools, licensing, and admin: net profit typically runs 8-15% of revenue for a well-managed small GC. On $650K, that’s $52K-$97K to the owner. The range is huge — and the difference is almost entirely in project selection and overhead control.
The Factors That Separate Profitable GCs From Struggling Ones
Job selection is everything. A GC who takes every job — small patch jobs, difficult clients, underpriced bids — will have high revenue and mediocre profit. The most profitable GCs focus on project types with predictable scope and clients vetted for decision-making style. Scope creep and slow-paying clients eat margin faster than any materials cost increase.
Markup discipline on materials and subs. Most GCs mark up materials 15-20% and subcontractor labor 10-15%. Don’t let clients pressure you to “just pass through at cost.” That markup covers coordination time, warranty liability, and the cash float you’re carrying between invoice and payment.
Contracts that protect against scope creep. A GC who does verbal change orders or doesn’t enforce the change order process loses 20-30% of margin on the average project. Every change that’s not documented and priced is money donated.
The Optimistic vs. Realistic Case
Optimistic: a GC who specializes in one project type (say, kitchen and bath remodels under $80K), has a 6-month backlog, and runs lean with trusted subs. Revenue: $800K. Net profit: 18%. Take-home: $144K.
Realistic: a GC trying to do everything, competing on price, handling mixed commercial and residential work. Revenue: $420K. Net profit: 9%. Take-home: $37K. Run both scenarios before committing to a business model.
Managing Subcontractors: Where Contractor Margins Actually Get Lost
For general contractors, subcontractor management is the single biggest driver of whether a project hits its margin target or bleeds below it. The bid-to-actual gap on subcontractor costs is where most project overruns originate. A framing sub who bids $22,000 and bills $28,500 due to “unforeseen conditions” just consumed roughly 3% of your project margin on a $200,000 contract — and that’s before addressing the client conversation about why costs changed.
The contractors with the tightest margins consistently do two things: they maintain a roster of 3-5 reliable subs per trade category rather than a single relationship, and they attach detailed scope-of-work documents to every subcontract. Multiple subs per trade creates competitive pressure on pricing and gives you options when a preferred sub is unavailable. Written scope specificity gives you contractual grounds to push back on “extras” — without it, subs have leverage to claim additional billing for work that was always part of the implied scope.
Material cost management is the second lever. Contractors who buy materials through their own supplier accounts rather than letting subs purchase and mark up typically recover 8-12% of material cost that would otherwise flow to the sub. On a $450,000 project with $150,000 in materials, that’s $12,000-$18,000 in margin that stays with you. The operational overhead of managing materials accounts and deliveries is real, but on projects above $75,000, the margin recovery almost always justifies it.
Change orders are the margin recovery mechanism most GCs underuse. Every change that isn’t documented and priced before execution is revenue you’re donating to the project. The shops with the highest net margins treat change order discipline as non-negotiable — every scope change, no matter how small, gets a written approval before the work starts. That habit alone typically adds 2-4 percentage points of net margin on renovation projects compared to shops that handle changes verbally.
The One Financial Habit That Separates Profitable Contractors From Struggling Ones
Profitable GCs review job costing weekly, not annually. At the end of each week, they compare projected labor and materials cost to actual cost on every open project. A project running 8% over budget in week 3 is recoverable. The same project discovered 8% over budget in week 8 is a loss you’re absorbing. The contractors who never get surprised by bad job results all have the same habit: they look at the numbers while there’s still time to act. The revenue calculator’s job costing section is built for exactly this weekly review — run it at the same time every week, no exceptions.
Keep reading (related guides):
- Mortgage Comparison Calculator: Find the Best Rate and Term
- How to Calculate Your Freelance Rate (So You Stop Undercharging)
- Free Etsy Pricing Strategy Tool for Etsy Sellers (2026)
- Free ADHD Freelancer Ops Tool: Finally a System That Works With Your Brain
- Debt Snowball vs Avalanche Calculator: Which Method Saves You More Money
Instant signup · Stripe-secure · Cancel in one click
What Most People Get Wrong
The single biggest mistake is treating revenue as the headline number. Revenue is vanity — margin is sanity, and cash-in-bank is reality. Two operators with identical top-lines routinely end the year $80K apart in take-home, because one priced for volume and the other priced for sustainability. The calculator above forces you to surface that gap before it hits your bank account.
The second mistake is modeling a “best case” and planning around it. The number you should plan around is the 30th-percentile scenario — enough demand to matter, but slower than you hoped. If the business still covers your living expenses there, you have real margin of safety. If it only works in the 80th-percentile case, you are building on sand.
The third mistake is ignoring your time as a cost. If you would otherwise earn $55/hr at a day job and this operation pays you effectively $18/hr for 60-hour weeks, the gap is the real price of running it. Plug your opportunity cost into the calculator and the picture often flips.
How to Pressure-Test Your Numbers
Start with the calculator, then stress-test three levers independently:
- Pricing: What happens to your take-home if you raise prices 10%, but lose 15% of volume? Most operators are surprised to find net income goes up.
- Costs: What happens if your largest input cost rises 20%? This is not hypothetical — it is a typical 12-month swing in most industries.
- Volume: What happens at 70% of your planned volume for 90 days? If that still covers fixed costs, you have a real business. If not, the model is fragile.
Running the calculator three ways takes about ten minutes. The clarity on the other side of those ten minutes is usually the difference between a confident operating plan and guessing for another six months.
Frequently Asked Questions
How accurate is this calculator?
The underlying math uses industry-standard margin and cost ranges sourced from the General Contractor Revenue: What Owners Make vs. What You’d Expect space. Your actual numbers depend on location, seasonality, and operating style, so treat this as a directional benchmark, not a guarantee. The more precisely you enter your inputs, the tighter the output range becomes.
Can I save my results?
A free Digital Dashboard Hub account saves every scenario you run, lets you compare side-by-side, and unlocks the full dashboard with expense tracking and month-over-month charts. The 14-day trial includes the complete tool library — no credit card required to start.
Who is this tool for?
It’s built for anyone pressure-testing a real decision — existing operators auditing their margins, side-hustlers deciding whether to go full-time, and prospective owners trying to sanity-check a business plan before signing a lease. You do not need any accounting background to use it.
What should I do with the results?
Start by comparing the output against your current (or projected) monthly take-home. If the gap is big, walk back the inputs and identify which lever — pricing, volume, or cost structure — is doing the damage. That is usually where the highest-leverage fix lives.
The Bottom Line
Most operators lose money not because the math is impossible, but because they never actually ran it. Fifteen minutes with the calculator beats three months of guessing. Run your numbers, screenshot the output, and use it as the baseline for every pricing and cost decision over the next quarter.
When you are ready to go deeper, the full Digital Dashboard Hub workspace lets you save scenarios, track actuals month-over-month, and see the trend before problems compound. That is the version that actually compounds the effort — spreadsheets forgotten in a Google Drive folder do not.
Next Steps
- Run the calculator above with your best current estimates.
- Re-run it with a pessimistic scenario (lower volume, higher costs) and a stretch scenario (better pricing, more efficient ops).
- Screenshot all three outputs so you have a baseline to compare against when reality arrives.
- Revisit monthly — the number that matters is the one that changes with your real P&L.
Ready for the full dashboard?
Unlock all 255 tools across business, creator, and health workflows.
Andy Gaber is the founder of Digital Dashboard Hub, a suite of 255+ interactive financial, productivity, and wellness tools. He built DDH after getting frustrated with financial apps that gave outputs without context. Follow along for tool tutorials, revenue analytics breakdowns, and honest takes on personal finance.