Your Restaurant Did $1.2 Million Last Year. You Took Home $48,000.
Enter your own numbers in the interactive tool below and get a real-time read. The dashboard version adds saved scenarios, history, and full feature access.
That’s not a hypothetical. That’s the reality for thousands of restaurant owners across the country. The restaurant industry has some of the highest gross revenues and lowest net margins of any business sector. You can be “busy every night” and still be broke — because a full dining room doesn’t mean profitable if your food cost is 38% instead of 30%.
Let’s break down exactly where restaurant money goes, why the margins are so thin, and how to model your numbers realistically.
The Industry-Standard Expense Breakdown
The “prime cost” — food plus labor combined — is the number every restaurant owner should check weekly. Industry target: 55-65% of revenue. If your prime cost exceeds 70%, you are losing money regardless of how many covers you serve.
Margins by Restaurant Type
Not all restaurants are created equal for profitability:
Bars consistently outperform restaurants on margin because liquor cost is 18-22% compared to food cost of 28-35%. A well-run bar with a food menu can hit 12-15% net margins. That’s why the “restaurant with a great bar program” model works — the drinks subsidize the food.
The Two Numbers That Determine Everything
Food Cost Percentage
If you remember nothing else from this article: your food cost percentage is revenue minus what you spent on ingredients, divided by revenue. If you sold $80,000 in food and spent $26,000 on ingredients, your food cost is 32.5%.
Every percentage point matters enormously. On $1M in annual revenue:
- 30% food cost = $300,000 in COGS
- 33% food cost = $330,000 in COGS
- Difference: $30,000/year straight to the bottom line
Three percentage points is often the difference between a profitable restaurant and a failing one.
Labor Cost Percentage
Post-2020 labor costs have been the biggest margin killer. Minimum wage increases, tip credit changes, and competitive hiring have pushed restaurant labor costs up 15-25% in many markets. A line cook who made $14/hour in 2019 now makes $18-$22 in most metro areas.
Want to model your restaurant’s specific margin breakdown? Our restaurant revenue calculators let you plug in your menu pricing, food cost targets, and labor model to see projected monthly profit by restaurant type.
How Profitable Restaurants Stay Profitable
The operators who consistently beat industry averages share these habits:
- Weekly food cost calculations. Not monthly, not quarterly. Every week, count inventory, calculate actual food cost, compare to target. Drift happens in days, not months.
- Menu engineering. Know which dishes have the highest margin and which are losers. Put the winners in the top right of the menu (where eyes go first). Remove or reprice the losers.
- Labor scheduling to revenue forecasts. Schedule staff based on projected covers, not habit. Tuesday lunch doesn’t need the same crew as Friday dinner. Over-staffing by one person for one shift costs $150-$250.
- Waste tracking. The average restaurant wastes 4-10% of purchased food. A waste log (what was thrown out, why, when) cuts this in half within 60 days.
The Revenue Targets You Need
General benchmarks for viability:
- Revenue per square foot: $150-$300/year for casual dining, $300-$600 for fast casual
- Revenue per seat: $6,000-$12,000/year
- Revenue per employee: $50,000-$80,000/year
- Average check needed to cover costs: Divide your monthly fixed costs by projected monthly covers. That’s your minimum average check.
Start With This
- Calculate your prime cost this week. Food cost + labor cost, divided by revenue. If it’s above 65%, that’s your emergency. Fix food cost through waste reduction and portion control. Fix labor through smarter scheduling.
- Run your break-even math. Total fixed costs per month divided by your average contribution margin per cover. That’s how many people you need through the door every month just to keep the lights on.
- Track daily. Revenue, covers, food purchases, labor hours — every day. The restaurants that fail are always the ones where the owner “checks the numbers once a month.”
Hundreds of business owners use Digital Dashboard Hub to track revenue vs. expenses in real time. Start your free trial and see your restaurant’s real margins at a glance.
A Real Restaurant P&L: Denver, Year One
Fast-casual Mexican concept. 62 seats, open 11am-10pm 7 days. Average ticket: $14.80. Covers per day: 210.
- Daily gross revenue: $3,108
- Monthly gross: ~$93,240
- Food cost (27%): $25,175
- Labor (32%): $29,837
- Rent: $8,400
- Utilities + delivery platforms + POS: $4,200
- Marketing, insurance, misc: $2,800
- Net operating profit: $22,828/mo (24.5% margin)
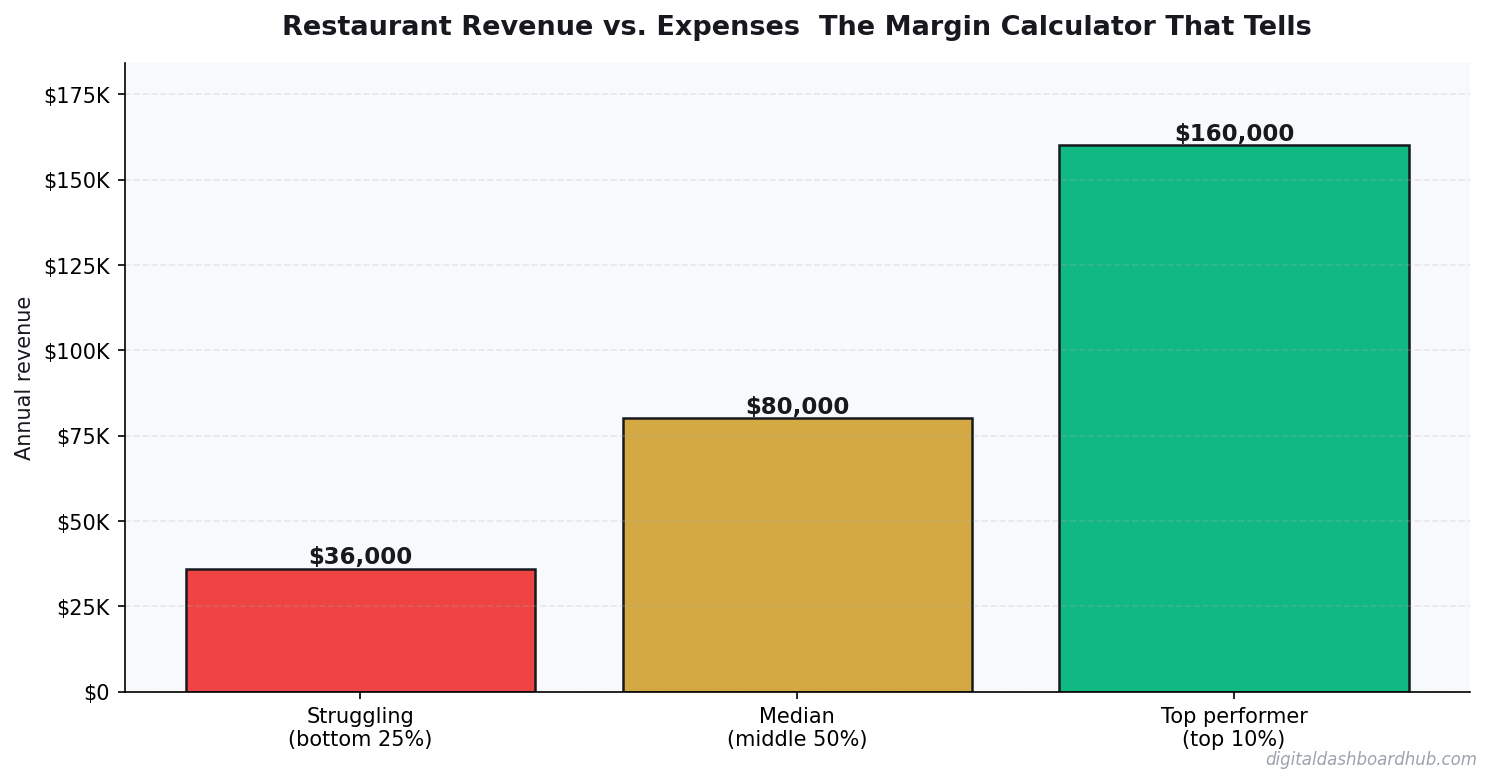
That’s well above the industry average of 3-9% net for full-service restaurants. Fast-casual wins on labor efficiency. If your restaurant concept can’t hit 20%+ net on paper before you open, the real-world version won’t hit 10%.
The Three Numbers That Determine Restaurant Survival
Prime Cost (Food + Labor as % of Revenue)
Industry standard: keep prime cost below 60-65% of revenue. Below 55% is excellent. Above 70% is a slow-motion failure regardless of how busy the dining room looks. Most struggling restaurants have prime costs at 72-78% — they feel busy but bleed money. Run this number weekly, not monthly.
Table Turn Rate
A full-service restaurant with 60 seats turning tables 2.5x on a Friday night grosses 37% more than the same restaurant at 1.8x turns with the same average ticket. You can’t raise prices and you can’t add seats — but you can train for faster service pacing. A 0.5x turn improvement on weekend nights is worth $80,000-$120,000/year in additional revenue for a mid-sized restaurant.
Third-Party Delivery Platform Dependency
DoorDash and Uber Eats take 25-30% commission on every order. A restaurant doing 20% of revenue through platforms is giving away 5-6 points of total margin — that’s often the difference between profit and loss. The restaurants winning at delivery have their own ordering apps or have negotiated flat-fee platform contracts. Dependency on third-party platforms at scale is margin death.
A Real Restaurant P&L: Denver, Year One
Fast-casual Mexican concept. 62 seats, open 11am-10pm 7 days. Average ticket: $14.80. Covers per day: 210.
- Daily gross revenue: $3,108
- Monthly gross: ~$93,240
- Food cost (27%): $25,175
- Labor (32%): $29,837
- Rent: $8,400
- Utilities + delivery platforms + POS: $4,200
- Marketing, insurance, misc: $2,800
- Net operating profit: $22,828/mo (24.5% margin)
That’s well above the industry average of 3-9% net for full-service restaurants. Fast-casual wins on labor efficiency. If your restaurant concept can’t hit 20%+ net on paper before you open, the real-world version won’t hit 10%.
The Three Numbers That Determine Restaurant Survival
Prime Cost (Food + Labor as % of Revenue)
Industry standard: keep prime cost below 60-65% of revenue. Below 55% is excellent. Above 70% is a slow-motion failure regardless of how busy the dining room looks. Most struggling restaurants have prime costs at 72-78% — they feel busy but bleed money. Run this number weekly, not monthly.
Table Turn Rate
A full-service restaurant with 60 seats turning tables 2.5x on a Friday night grosses 37% more than the same restaurant at 1.8x turns with the same average ticket. You can’t raise prices and you can’t add seats — but you can train for faster service pacing. A 0.5x turn improvement on weekend nights is worth $80,000-$120,000/year in additional revenue for a mid-sized restaurant.
Third-Party Delivery Platform Dependency
DoorDash and Uber Eats take 25-30% commission on every order. A restaurant doing 20% of revenue through platforms is giving away 5-6 points of total margin — that’s often the difference between profit and loss. The restaurants winning at delivery have their own ordering apps or have negotiated flat-fee platform contracts. Dependency on third-party platforms at scale is margin death.
Keep reading (related guides):
- Business Expense Tracker: Categorize and Export for Tax Time
- How Much Money You Need to Retire Early at 40, 45, and 50 (Real Numbers by Age)
- Our Wedding Budget Was $20K. We Spent $28K. Heres Where It All Went Wrong.
- Youre Probably Wasting $200/Month on Subscriptions You Forgot About (Heres How to Find Them)
- Auto Mechanic Revenue: What Owners Make vs. What Youd Expect (2026)
255+ interactive tools for your money, time, and health.
Full features for 14 days · Secure payment · Stop anytime
Keep Reading
- The Side Hustle Tax Trap: Track Every Dollar
- Freelancer Finance Dashboard: Track Income, Taxes, and Cash Flow
- How Sinking Funds Saved Me from Financial Emergencies
Common Questions About Restaurant Revenue vs. Expenses: The Margin Calculator That Tells the Truth
How long does it take to see results?
Most people see meaningful progress within 30-90 days when they apply these strategies consistently. The key is tracking your numbers from day one so you have a baseline to measure against.
What’s the biggest mistake people make?
Trying to do everything at once. Pick one or two strategies from this guide, implement them fully, then layer in additional tactics. Spreading yourself thin is the fastest way to see no results from any of it.
Do I need special tools or software?
Not necessarily to start — but the right tools eliminate hours of manual work. Our free calculators and trackers at Digital Dashboard Hub are a good starting point before you invest in paid software.
Andy Gaber is the founder of Digital Dashboard Hub, a suite of 255+ interactive financial, productivity, and wellness tools. He built DDH after getting frustrated with financial apps that gave outputs without context. Follow along for tool tutorials, revenue analytics breakdowns, and honest takes on personal finance.