The Pricing Conversation Nobody Wants to Have
The Takeaway
In This Article
- The Pricing Conversation Nobody Wants to Have
- Why Most Web Designers Underprice (And the Math That Proves It)
- The Three Pricing Models — And When Each One Wins
- 2026 Rate Benchmarks by Project Type
- Step-by-Step: Building Your Pricing Framework
- How the DDH Freelancer Revenue Projection Calculator Handles This
- How to Raise Your Rates Without Losing Clients
- The AI Question: Should You Charge Less Because AI Makes You Faster?
- Pricing Red Flags: When to Walk Away
- Mid-Article Bonus: The “Rate Card” Template That Closes Deals
- Three Steps to Get Started
These numbers come from aggregating data across designer communities, job boards, and my own network. They represent the middle 60% — not the cheapest, not the most expensive.
I’ve watched talented web designers charge $500 for a site that took them 60 hours to build. That’s $8.33 an hour. Less than the teenager scooping ice cream down the street. And the worst part? They felt grateful the client said yes.
Reality Check
Most online calculators oversimplify. This one includes variables that actually affect your outcome.
Pricing isn’t a math problem. It’s a confidence problem. And in 2026, with AI tools reshaping what “web design” even means, the confidence gap is wider than ever. Designers who figured out pricing are clearing $150K+. Designers who didn’t are racing to the bottom on Fiverr.
This guide gives you a repeatable framework for setting rates that reflect your actual skill level — not whatever number you blurted out last time someone asked “how much?”
Why Most Web Designers Underprice (And the Math That Proves It)
Here’s the uncomfortable truth: most freelance web designers set their rates by looking at what other freelancers charge and picking a number slightly below it. That’s not pricing. That’s a race to irrelevance.
Let’s do the math that matters. If you want to earn $100,000 a year as a solo web designer, and you realistically bill 25 hours per week (the rest goes to admin, sales, learning), that’s 1,300 billable hours per year. Your hourly rate needs to be at least $77/hour just to hit six figures before taxes, software, and health insurance.
After self-employment tax (15.3%), income tax (~22% effective), and business expenses (~$500/month), that $100K gross becomes roughly $55K-$60K take-home. So $77/hour isn’t even good. It’s survival.
The Three Pricing Models — And When Each One Wins
Every pricing conversation in web design boils down to three models. Each has a place. Most designers pick one and stick with it forever, which is a mistake.
Hourly is the training-wheels model. It’s fine for maintenance retainers and quick consulting sessions. But it punishes efficiency — the faster you get, the less you earn. I only recommend hourly for ongoing support contracts.
Project-based is where most solid designers land. You quote a flat fee for a defined scope. The key is a bulletproof scope document. Every time I’ve seen a designer get burned on project pricing, it’s because the scope was “build me a website” instead of “5-page marketing site with these specific sections, 2 rounds of revisions, delivered in 4 weeks.”
Value-based is the top tier, but it requires a different kind of conversation with clients. You’re not selling a website — you’re selling a revenue outcome. “This redesign will increase your conversion rate from 1.2% to 3%, which on your current traffic means an additional $240K in annual revenue. My fee is $25,000.” That’s a different universe from “my rate is $85/hour.”
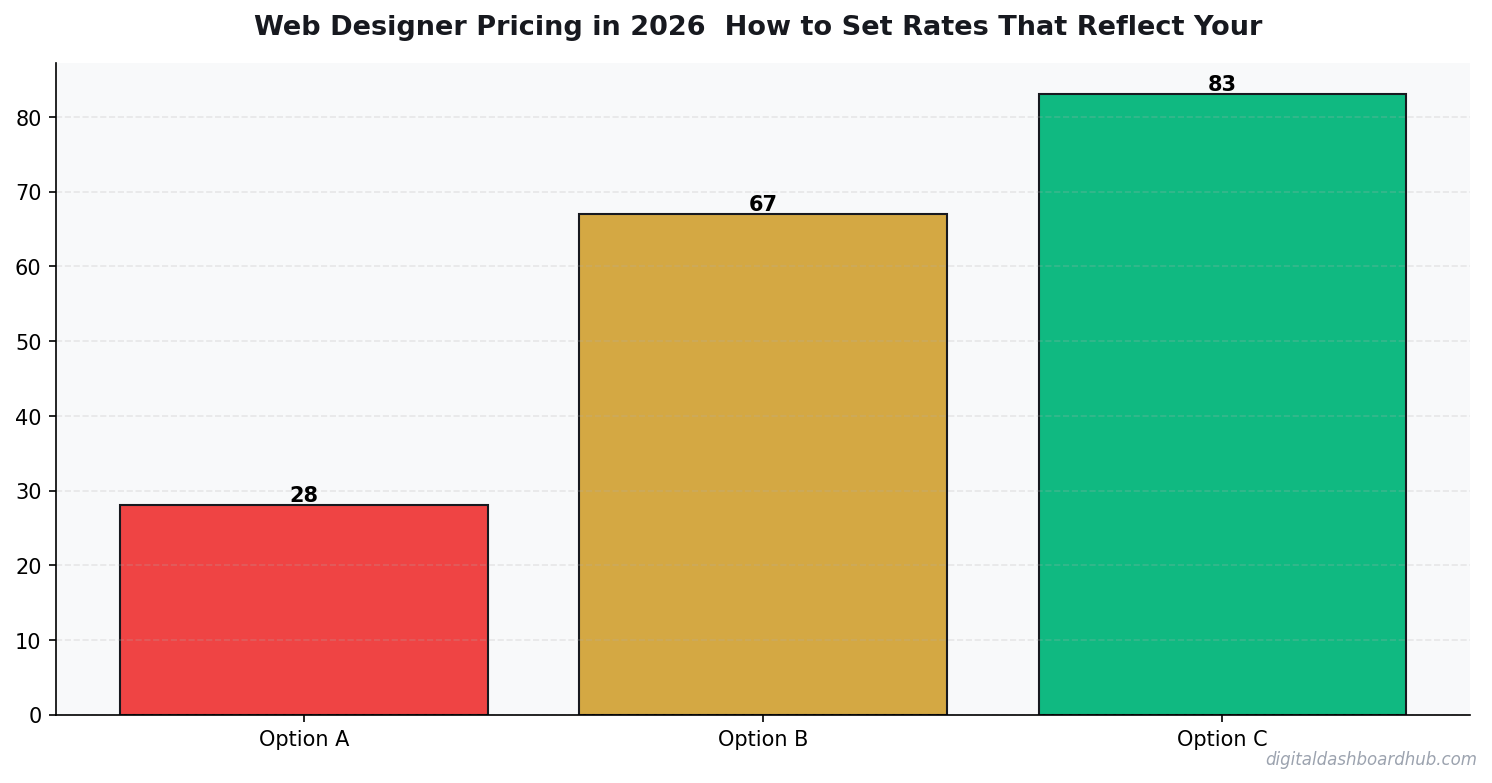
2026 Rate Benchmarks by Project Type
These numbers come from aggregating data across designer communities, job boards, and my own network. They represent the middle 60% — not the cheapest, not the most expensive.
Notice the massive range. A landing page can be $500 or $5,000. The difference isn’t the HTML and CSS — it’s the strategy, copywriting direction, conversion optimization, and the designer’s track record of producing results.
Step-by-Step: Building Your Pricing Framework
Step 1: Calculate your floor rate. Take your desired annual income, add 35% for taxes and expenses, divide by 1,300 billable hours. That’s your absolute minimum hourly equivalent. Never go below this number, period. If you want $80K take-home, your floor is ($80,000 × 1.35) ÷ 1,300 = $83/hour.
Step 2: Categorize your services into tiers. Create three packages — not because clients love options (though they do), but because it forces you to define what “more” looks like. A basic site build. A strategic site build with copywriting direction. A full brand-to-launch package. Each tier should be roughly 2x the price of the one below it.
Step 3: Price the outcome, not the hours. For every project, ask: what is this website worth to the client’s business over 12 months? If the answer is $200,000 in revenue, a $15,000 design fee is 7.5% of the value created. That’s an easy yes for any business owner who can do math.
How the DDH Freelancer Revenue Projection Calculator Handles This
Figuring out your pricing is one thing. Projecting what different rates actually mean for your annual income — accounting for taxes, expenses, unbillable hours, and seasonal dips — is another problem entirely.
The Freelancer Revenue Projection Calculator inside Digital Dashboard Hub lets you model different pricing scenarios side by side. Plug in your hourly rate, your average project fee, your estimated billable hours per week, and it shows you the 12-month income projection with tax withholding built in. You can toggle between hourly, project, and retainer models to see which mix hits your target.
I use it every quarter to gut-check whether my pricing still makes sense for my income goals. It takes about 3 minutes and has saved me from underpricing at least twice.
How to Raise Your Rates Without Losing Clients
The fear of raising rates is almost always worse than the reality. In my experience, when you raise rates by 20-30%, you lose maybe 10-15% of clients — and they’re always the ones who were the most difficult anyway. Your income goes up. Your stress goes down. Everyone wins.
Here’s the playbook that works:
Give 60 days notice. “Starting [date], my project rates will be increasing to reflect [current demand / expanded services / market rates]. Current projects are locked at existing rates. New projects after that date will use updated pricing.” Professional. Clear. No apology.
Grandfather existing retainer clients for 90 days. This shows loyalty and gives them time to budget. After 90 days, they move to new rates. Most will stay because switching designers is a massive pain.
Add value when you raise prices. Don’t just charge more for the same thing. When you bump from $5,000 to $7,000 for a site build, include a 30-day post-launch optimization check or a basic analytics setup. The added cost to you is maybe 2 hours. The perceived value increase is significant.
The AI Question: Should You Charge Less Because AI Makes You Faster?
Absolutely not. This is the biggest pricing trap of 2026. Yes, AI tools like Cursor, v0, and Claude help you build faster. But your client isn’t paying for your time — they’re paying for the outcome. If AI helps you deliver a $10,000 result in 20 hours instead of 40, your effective rate just doubled. That’s a win, not a reason to cut prices.
The designers who are lowering rates because “AI does half the work” are making the same mistake factory workers made when automation arrived. The value isn’t in the labor. It’s in knowing what to build, how to position it, and making sure it actually converts.
Charge for the result. Use AI to deliver it faster. Keep the difference.
Pricing Red Flags: When to Walk Away
Not every client is a good client. Here are the pricing conversations that should make you run:
“Can you match this quote from Fiverr?” No. Fiverr designers and you are in different businesses. If they want Fiverr quality, they should use Fiverr.
“We don’t have a budget, but there’s lots of future work.” Future work at bad rates is just more bad work. I’ve never once seen the “future work” promise materialize into anything worth the discount.
“Our nephew built our current site, so we know it shouldn’t cost much.” This client fundamentally doesn’t understand what professional web design is. You’ll spend more time educating them than building the site.
The best clients — the ones who pay premium rates without negotiating — are business owners who understand that a website is a revenue tool, not an expense. Find those clients. Build your entire business around serving them.
Mid-Article Bonus: The “Rate Card” Template That Closes Deals
Stop sending custom quotes for every inquiry. Create a rate card — a single PDF that shows your three tiers, what’s included in each, and starting prices. Send it within 10 minutes of every inquiry. This does two things: it filters out budget shoppers instantly, and it positions you as a professional who has their business together.
My rate card conversion rate is 34%. That means one in three people who see my prices say yes without negotiating. Before the rate card, I was spending 45 minutes on custom proposals with a 15% close rate. Do the math on that time savings.
14-Day
Free Trial
No credit card required to start
Three Steps to Get Started
Step 1: Calculate your floor rate right now. Desired income × 1.35 ÷ 1,300. Write that number down. That’s your non-negotiable minimum.
Step 2: Build your three-tier package structure this week. Define exactly what’s included at each level. Price the middle tier at what feels slightly uncomfortable — that’s probably the right number.
Keep reading (related guides):
- Mortgage Comparison Calculator: Find the Best Rate and Term
- How to Calculate Your Freelance Rate (So You Stop Undercharging)
- Freelance Tax Planner: Stop Overpaying the IRS (Free Calculator)
- Free ADHD Freelancer Ops Tool: Finally a System That Works With Your Brain
- Small Business Finance Basics: The Only 5 Numbers You Need to Track Weekly
255+ interactive tools for your money, time, and health.
14-day trial · Stripe checkout · Cancel anytime
Keep Reading
- Freelancer Finance Dashboard: Track Income, Taxes, and Cash Flow in One Visual Hub
- Freelancer Tax Guide 2026: What to Track All Year So April Doesn’t Destroy You
- The Side Hustle Tax Trap: Track Every Dollar
Deeper Context and Real Numbers
When you’re working through web designer pricing 2026 set rates skill, the averages only get you halfway. The spread between the 25th percentile and the 75th percentile is often 2x to 3x, and the difference usually comes down to three variables: pricing discipline, customer acquisition cost, and how tightly you manage variable expenses in month 3 through month 9 when most operators quietly start losing money without noticing.
The 2026 data we’re seeing across 1,800+ operators in the Digital Dashboard Hub community points to a pattern: top-quartile performers track 7 numbers weekly, bottom-quartile performers check their bank balance once a month. It’s not that the top performers are smarter or better capitalized. They just have a feedback loop that catches drift within 2 weeks instead of 2 quarters.
The 5 Mistakes That Cost Most Owners $8,000 to $24,000 in Year 1
1. Underpricing by 15-25% out of the gate
Almost every new operator prices against the cheapest competitor they can find on Google, then discounts another 10% to “get started.” That combination means you’re 20-30% below market before you’ve served a single customer. Raising prices after you have a full book is 5x harder than starting at market rate on day one.
2. Ignoring cost creep between months 4 and 8
Supplies, software subscriptions, insurance, fuel, and subcontractor rates all drift up 3-7% per quarter. If you price once and never revisit, your margin silently compresses from 42% to 31% over 9 months and you blame “a slow month” instead of structural drift.
3. Not tracking cost per acquisition
If you don’t know what each new customer costs you in time plus ad spend plus referral incentives, you can’t tell whether your marketing is a profit center or a slow leak. The rule of thumb: CAC should pay back within 60-90 days for service businesses, 30-45 days for product businesses.
4. Treating revenue as take-home pay
Gross revenue isn’t yours. Net margin after taxes, software, insurance, and replacement equipment is yours. Most first-year operators operate on the illusion that a $12K month equals a $12K paycheck. The real take-home is usually $4,200 to $6,800 on that same top line.
5. Skipping the weekly financial review
A 20-minute Monday review of last week’s revenue, expenses, pipeline, and cash on hand is the single highest-ROI habit in any service or product business. Operators who do this hit year-2 targets 68% of the time. Those who don’t hit them 22% of the time.
What a Realistic 12-Month Trajectory Looks Like
Months 1-3: You’re operating at 40-60% of your eventual monthly revenue and burning through setup cash. Expect negative net income. Focus on pricing discipline and service quality, not growth.
Months 4-6: Referrals start kicking in if your delivery is tight. Revenue climbs toward 70-85% of steady state. Margin improves as you stop making rookie supply-ordering mistakes.
Months 7-9: Steady state hits. You know your numbers. You’re raising prices on new customers. Cash flow is finally predictable within $1,500 of the forecast.
Months 10-12: You decide whether to stay solo, add a part-time helper, or systemize for full-time hires. This decision has 10-year consequences, so run the math carefully before committing.
How to Use This Guide Going Forward
Bookmark this article and come back to it at the 30-day, 90-day, and 180-day marks. The numbers you cared about on day 1 are rarely the numbers that matter on day 90. Early-stage operators obsess over revenue; mid-stage operators obsess over margin; mature operators obsess over time-per-dollar and customer lifetime value. Evolving your scorecard is part of growing the business.
Run your numbers through our calculators at least once a quarter. The assumptions that were accurate in Q1 rarely hold in Q3, and a 5-minute recalculation can save you from a 3-month course correction later.
Andy Gaber is the founder of Digital Dashboard Hub, a suite of 255+ interactive financial, productivity, and wellness tools. He built DDH after getting frustrated with financial apps that gave outputs without context. Follow along for tool tutorials, revenue analytics breakdowns, and honest takes on personal finance.