You’re 43 and suddenly you can’t sleep through the night. Your anxiety spiked out of nowhere. You forgot three things before lunch. Your joints ache. And when you Google “am I going crazy,” the answer that keeps coming back is: perimenopause. But your doctor said “your labs look normal” and sent you home.
Sound familiar? You’re not imagining it. Perimenopause can start a full decade before your last period, and it has over 40 documented symptoms — most of which never show up on a standard blood panel. The DDH Menopause & Perimenopause Symptom Tracker is a free interactive dashboard that helps you map what’s actually happening in your body so you can advocate for yourself with data, not just feelings.
The Invisible Health Transition Nobody Prepares You For
Perimenopause typically begins between ages 40-44, though it can start in the late 30s. Over 1.3 million women enter menopause each year in the US alone, yet the average OB-GYN receives fewer than 7 hours of menopause-specific training in medical school. That’s not a typo. Seven hours for a transition that lasts 7-14 years and affects literally every system in the body.
The result? Women spend an average of $800+ per year on symptom relief (supplements, sleep aids, skincare, therapy) without understanding the root cause. Many get misdiagnosed with anxiety, depression, or thyroid disorders. Hormone replacement therapy (HRT) conversations get delayed because nobody connected the dots between insomnia, brain fog, joint pain, and the hormonal shift driving all of it.
A menopause symptom tracker changes this. Not by diagnosing you — but by giving you clear, timestamped, pattern-based evidence of what your body is doing.
What This Dashboard Tracks
The Full Symptom Spectrum. Hot flashes and night sweats are just the headline act. This tracker covers 34 perimenopause and menopause symptoms across 6 categories: vasomotor (flashes, sweats), cognitive (brain fog, memory, focus), musculoskeletal (joint pain, stiffness), psychological (anxiety, mood swings, irritability), sleep (insomnia, night waking, quality), and metabolic (weight changes, bloating, energy). Each logged daily with severity 1-5.
HRT & Supplement Protocol Tracking. Estrogen patches, progesterone, testosterone cream, DHEA, magnesium, ashwagandha — log your full protocol. The dashboard maps medication adherence against your symptom trends so you can see if dosage changes or new supplements are making a measurable difference.
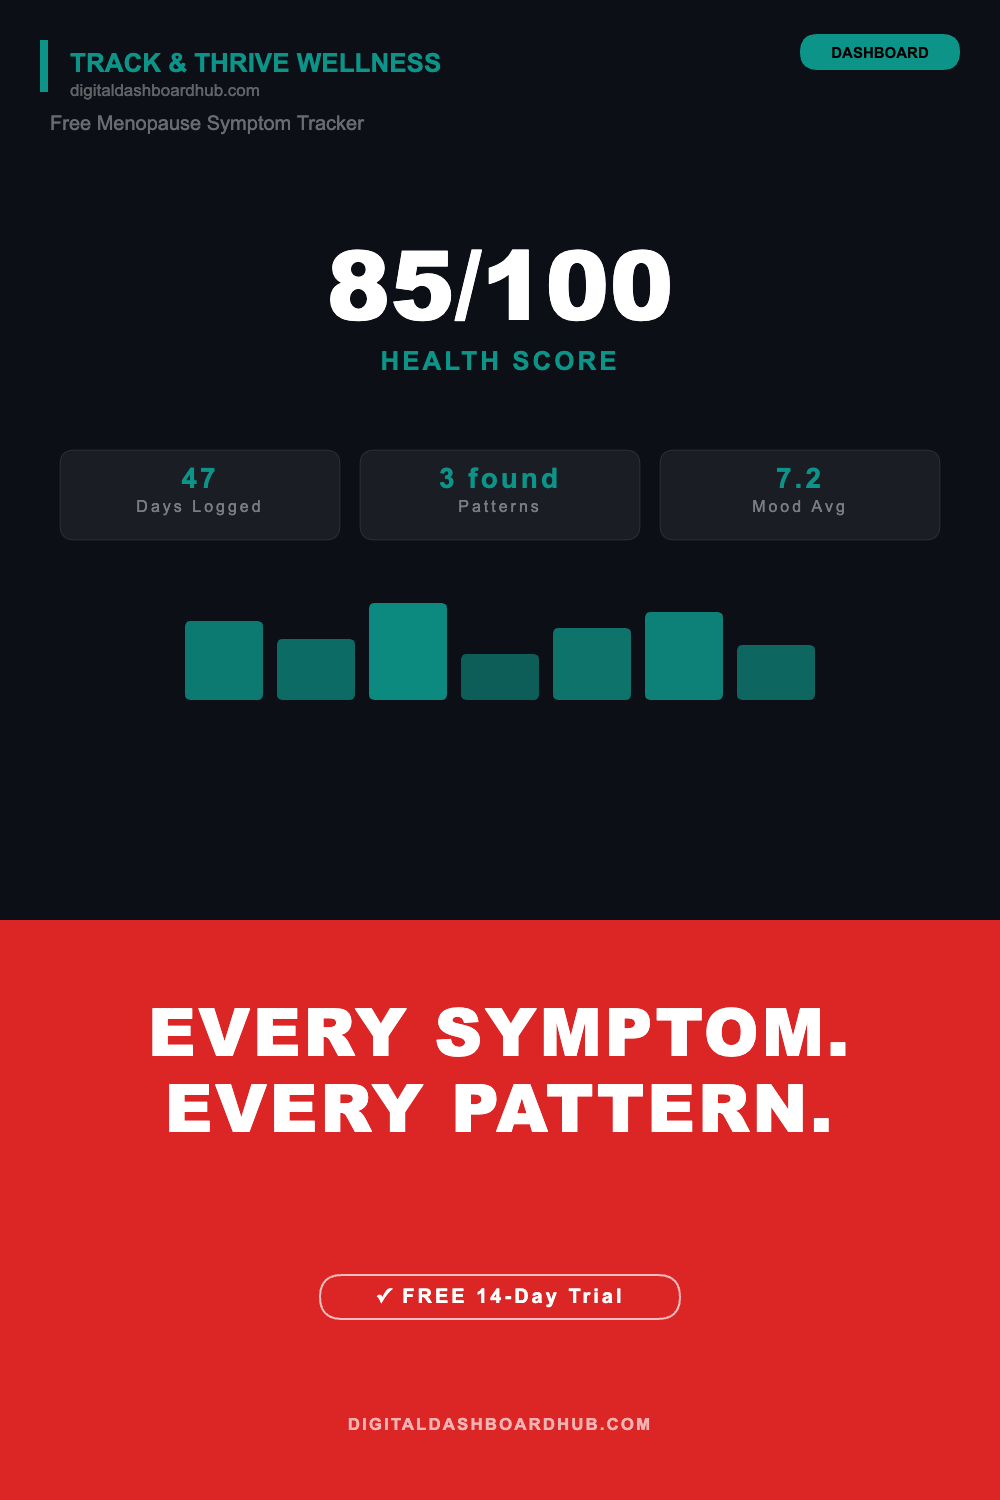
The Menopause Severity Index. A single composite score (0-100) that synthesizes your symptom data into one trackable number. It’s based on the validated Greene Climacteric Scale methodology, adapted for daily self-reporting. When your score drops from 71 to 52 over two months, you KNOW something is working — you’re not just hoping.
Sleep Quality Deep Dive. Because sleep disruption is the symptom that amplifies every other symptom. The tracker monitors hours slept, wake-ups, night sweats frequency, and morning energy. Sleep trend data alone has been the breakthrough insight for many women managing perimenopause.
Trigger & Relief Pattern Mapping. Track what makes symptoms worse (alcohol, caffeine, stress, heat, specific foods) and what helps (exercise, cold exposure, supplements, breathing techniques). After 30 days, the dashboard shows your personal trigger and relief profiles.
Doctor Visit Summary. One-click report: symptom trends, medication changes, sleep data, and your severity index trajectory over time. Bring this to your appointment. It turns a vague “I feel terrible” into a data-backed conversation about treatment options.
60 Seconds a Day, Massive Clarity
Step 1: Set up your symptom profile. Select which of the 34 symptoms you experience — you can always add more later.
Step 2: Each morning, rate your previous day: symptom severities, sleep quality, medications taken, and any triggers or relief strategies you noticed. This takes under 60 seconds once you’ve done it a few times.
Step 3: Review your weekly and monthly dashboards. The severity index, symptom heatmap, and trend charts update automatically. By week 4, you’ll have more organized data about your menopause transition than most women collect in years.
Finally — A Tool That Takes This Seriously
| Feature | Generic Health App | DDH Menopause Tracker |
|---|---|---|
| Symptoms tracked | 5-10 basics | 34 across 6 categories |
| HRT protocol tracking | Rarely | Full medication + supplement log |
| Severity scoring | No | Validated composite index |
| Sleep deep dive | Basic | Night sweats, wake-ups, morning energy |
| Trigger/relief mapping | No | Personalized pattern detection |
| Doctor visit report | No | One-click summary |
| Designed for menopause | Afterthought | Purpose-built |
| Price | $10-30/mo | Free to try |
FREE BONUS: The Perimenopause Symptom Checklist — All 40+ Symptoms You Might Not Know Are Connected
A printable reference sheet listing every documented perimenopause symptom by category, with space to mark which ones you’re experiencing. Most women circle 8-15 and realize for the first time that these “random” symptoms have a single cause.
Get instant access when you sign up below.
Start Tracking — Your Future Self Will Thank You
Perimenopause is not something that just “happens to you.” It’s a transition you can navigate with clarity — if you have the data. This tracker gives you that data in 60 seconds a day.
Try it free and see your symptom patterns in real time → digitaldashboardhub.com/trial
Available as a Google Sheets dashboard and interactive web app. Also on Etsy.
Keep Reading
- PCOS Symptom Tracking: A Complete Guide
- The Science of Sleep Tracking
- The Science Behind Habit Tracking
Disclaimer: This tool is for informational and educational purposes only. It is not medical advice and does not diagnose, treat, or manage any medical condition. Always consult a qualified healthcare provider about menopause management and HRT decisions.