
Not All Food Businesses Are Created Equal — And the Margins Prove It
Enter your own numbers in the interactive tool below and get a real-time read. The dashboard version adds saved scenarios, history, and full feature access.
Before DDH, I was doing this manually in spreadsheets. Here’s the faster way:
If you search “most profitable food business,” you’ll get listicles ranking restaurant types by revenue. Revenue is the wrong metric. A food truck grossing $350,000 with 12% margins puts more money in the owner’s pocket than a restaurant grossing $800,000 with 3% margins. Profitability is what pays your bills. Revenue is what pays everyone else’s.
This is a step-by-step guide to evaluating which food business model to start in 2026, ranked not by revenue but by what actually matters: net profit margin, startup cost, time to profitability, and owner take-home pay. I’m comparing five models: ghost kitchens, food trucks, catering, meal prep delivery, and traditional restaurants.
Step 1: Understand the Five Food Business Models
Each model has a fundamentally different relationship between revenue, expenses, and the owner’s time. Understanding the structure before looking at numbers prevents the most common mistake — comparing a food truck’s revenue to a restaurant’s revenue as if they’re the same business.
Ghost kitchen: A delivery-only restaurant operating from a commercial kitchen with no dining room, no front-of-house staff, and no storefront. Orders come through apps (DoorDash, UberEats, etc.) or direct online ordering. The model eliminates rent and FOH labor at the cost of delivery platform fees (15-30% of order value).
Food truck: Mobile food service with low fixed costs and location flexibility. Limited menu, limited staff (typically 2-3 people including the owner), and limited operating hours. Revenue ceiling is constrained by the truck’s physical capacity.
Catering: Event-based food service with highly variable revenue. No fixed location needed (operate from a commissary kitchen). Revenue spikes during event season and drops during slow months. High margins on large orders, but inconsistent cash flow.
Meal prep delivery: Subscription-based pre-made meal service. Customers order weekly or biweekly meal packages delivered to their door. Growing rapidly since 2022. Recurring revenue model with high customer retention.
Traditional restaurant: Brick-and-mortar dining establishment. Highest revenue ceiling, highest startup cost, lowest margins, and the most complex operations of any food business model.
Step 2: Compare the Numbers Side by Side
Two models stand out on pure profitability: meal prep delivery (12-20% margins) and catering (10-18% margins). Two stand out on speed to profitability: catering (2-4 months) and ghost kitchens (3-6 months). Traditional restaurants rank last in almost every metric except raw revenue ceiling.
Step 3: Evaluate Ghost Kitchens (The 2026 Disruptor)
Ghost kitchens exploded during COVID and have matured into a legitimate permanent model. The value proposition is simple: all of a restaurant’s cooking capability, none of its dining room costs. No hosts, no servers, no table bussers, no decor, no parking lot, no storefront signage.
The financials work like this: rent a kitchen space ($2,000-$5,000/month in a shared commissary or ghost kitchen facility), hire 2-3 kitchen staff, and fulfill orders through delivery platforms. Food cost runs 28-32%, labor is 20-25% (much lower than a restaurant because no FOH), and occupancy is 5-8%. The catch: delivery platform fees eat 15-30% of every order’s revenue.
At a $300,000 annual revenue with 30% food cost, 22% labor, 6% rent, 20% delivery fees, and 10% other expenses, a ghost kitchen nets $36,000 (12%) in year one. That’s comparable to a restaurant’s take-home but with $30,000 in startup costs instead of $300,000.
The scalability play is what makes ghost kitchens interesting. From one kitchen, you can operate multiple “brands” — a burger brand, a poke bowl brand, a chicken wing brand — each with its own listing on delivery apps. Same kitchen, same staff, same ingredients (mostly), three revenue streams. This multi-brand approach can push a single ghost kitchen to $500,000-$800,000 in annual revenue.
Step 4: Evaluate Food Trucks (The Proven Performer)
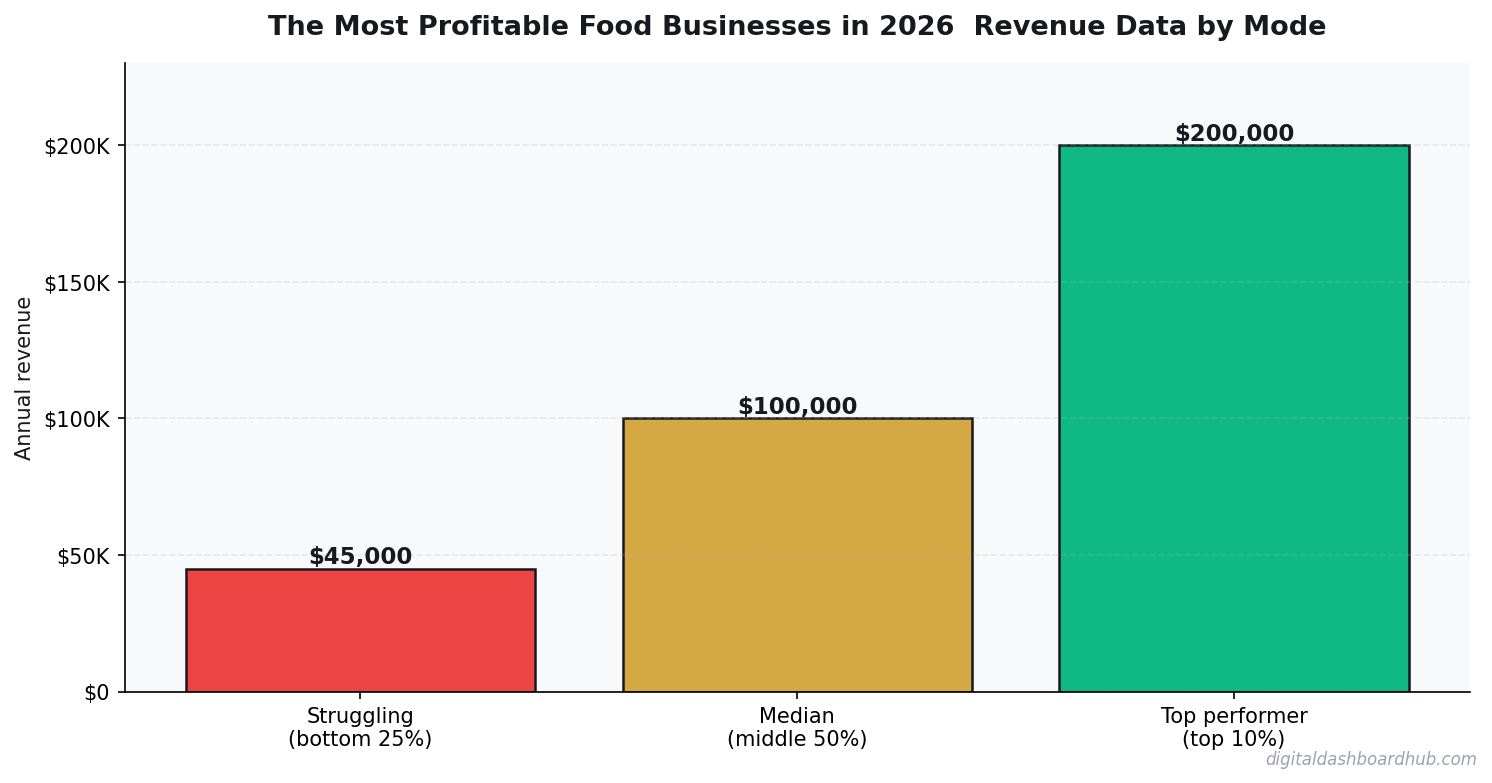
Food trucks have the longest track record of any alternative food business model, and the data is well-established. Average food truck revenue in 2025 was $290,000. Top performers in strong markets hit $450,000-$500,000. The median owner take-home after all expenses was $42,000.
The advantages are real: low fixed costs (no rent), location flexibility (go where the customers are), built-in marketing (a truck parked on a busy street is its own billboard), and a loyal following that tracks you on social media. The community aspect of food trucks creates customer relationships that brick-and-mortar restaurants struggle to match.
The disadvantages are also real: weather dependence, mechanical breakdowns (the truck is your restaurant AND your vehicle — when it breaks, everything stops), health department requirements that vary wildly by city, limited operating hours, and the physical toll of working in a hot, cramped metal box for 8-12 hours a day.
If you’re starting a food business for the first time, a food truck is the lowest-risk way to test your concept. The startup cost is manageable ($75,000-$150,000 for a well-equipped used truck), the time to profitability is reasonable (4-8 months), and if it doesn’t work, you can sell the truck and recover a significant portion of your investment. You can’t sell a restaurant buildout.
Step 5: Evaluate Catering (The Hidden Margin King)
Catering consistently has the highest per-event margins in the food industry. A catering job for 100 people at $45/plate grosses $4,500. Food cost: $1,125 (25%). Labor: $675 (15%). Equipment rental: $200. Transport: $100. Total cost: $2,100. Profit: $2,400 per event. That’s a 53% margin on a single event.
Over a year with 80-120 events, a solo caterer or small catering operation can gross $200,000-$400,000 with 10-18% net margins after accounting for slow months, marketing, insurance, and the commissary kitchen. The per-event margins are spectacular; the challenge is consistent volume.
Catering’s weakness is revenue inconsistency. Wedding season (May-October) brings 60-70% of annual revenue. November through April is lean. This creates cash flow challenges — you need to save aggressively during peak season to fund the slow months. Many caterers supplement with meal prep, pop-up dinners, or corporate lunch contracts during the off-season.
The startup cost is the lowest of any food business model. You need a commissary kitchen rental ($500-$1,500/month), equipment (chafing dishes, transport containers, serving ware — $3,000-$8,000), a vehicle capable of transport, and insurance. Total: $10,000-$30,000 to start. Some caterers start for under $5,000 using a shared kitchen and rented equipment.
How the DDH Revenue Calculator Handles This
Comparing five different food business models requires modeling five different financial structures — different cost ratios, different revenue patterns, different scaling paths. Doing this in a spreadsheet is doable but time-consuming. Doing it in a calculator designed for food businesses takes about 15 minutes.
The DDH Business Revenue Calculator lets you select your food business model, input your specific variables (menu price, daily volume, cost percentages), and see a full P&L instantly. Then you can switch models and run the same exercise for a different format, comparing the outputs side by side.
The feature that I think is most valuable for aspiring food entrepreneurs is the startup cost vs. time to ROI comparison. It shows you how many months it takes to recoup your initial investment in each model. A food truck at $100,000 startup earning $45,000/year nets a 26-month payback. A restaurant at $400,000 startup earning $60,000/year nets an 80-month payback. Seeing those payback periods side by side often reframes the decision entirely.
Step 6: Evaluate Meal Prep Delivery (The Subscription Model)
Meal prep delivery is the newest model on this list and arguably the most interesting from a financial structure perspective. It’s the only food business with true recurring revenue — customers subscribe to weekly meal packages, creating predictable, repeating income.
The typical model: offer 8-12 meal options per week, customers select 5-10 meals, price at $9-$14 per meal, and deliver weekly within a defined radius. A meal prep operation with 80-120 weekly subscribers generates $50,000-$120,000/year in the first year, scaling to $200,000-$400,000 by year three as word-of-mouth builds.
Margins are strong because meal prep has inherent efficiencies: you cook in bulk (reduces per-meal labor), you control portions precisely (reduces waste), you plan the menu in advance (enables bulk purchasing at lower costs), and customers prepay (no bad debt). Net margins of 12-20% are achievable and sustainable.
The challenge is customer acquisition. Unlike a food truck or restaurant where foot traffic provides customers, meal prep delivery requires active marketing — social media, local advertising, partnership with gyms and wellness centers, sampling events. Customer acquisition cost runs $30-$60 per subscriber, but the average subscriber stays 4-6 months, making the unit economics favorable if you can fund the initial acquisition period.
Mid-Article Bonus: The Hybrid Model That’s Winning in 2026
The smartest food entrepreneurs in 2026 aren’t choosing one model — they’re combining two or three. The most common hybrid: a ghost kitchen that also does meal prep delivery and accepts catering orders. Same kitchen, same ingredients, three revenue streams with different peak times and seasonal patterns.
A kitchen handling $200,000 in delivery orders, $100,000 in meal prep subscriptions, and $80,000 in catering does $380,000 in annual revenue from one facility. The diversification smooths out cash flow (catering is seasonal, delivery is consistent, meal prep is recurring) and increases kitchen utilization (you’re cooking for different channels at different times of day).
This hybrid approach also reduces risk. If delivery platform fees increase (they always do), you have two other revenue streams. If catering slows in winter, delivery and meal prep cover the gap. The single biggest risk in any food business is revenue concentration — being dependent on one channel for all your income.
Step 7: The Decision Framework
Choose based on three factors: your available capital, your risk tolerance, and your desired lifestyle.
Under $30K to invest: Start with catering or meal prep delivery. Both require minimal startup capital and can generate revenue within weeks. Scale into additional models (ghost kitchen, food truck) using profits from the first model.
$30K-$100K to invest: Food truck or ghost kitchen. Both offer good margins, reasonable timelines to profitability, and the ability to test your concept before committing to a permanent location.
$100K+ to invest: Consider a hybrid model — ghost kitchen plus meal prep, or food truck plus catering. Multiple revenue streams from the start reduce risk and increase ceiling.
$300K+ to invest: Only now does a traditional restaurant make financial sense. And even then, consider whether a ghost kitchen at $50K startup with $80K annual profit is better than a restaurant at $400K startup with $60K annual profit. The restaurant has higher revenue, but the ghost kitchen has higher return on investment.
The Numbers That Matter Most
Regardless of which model you choose, three numbers will determine your success:
First: food cost percentage. Keep it under 32%. Above that, you’re either pricing too low, wasting too much, or buying too expensively. Track this weekly, not monthly.
Second: customer acquisition cost. Know what it costs to get one new customer or subscriber. If you’re spending $50 to acquire a customer who spends $40 once and never returns, you’re buying revenue at a loss. If you’re spending $50 to acquire a subscriber who pays $100/month for 5 months, you’re printing money.
Third: owner hours per dollar of profit. If you’re making $50,000/year working 60 hours/week, your effective hourly rate is $16. That’s less than your kitchen staff earns. The goal isn’t just profit — it’s profit relative to the time and stress you invest.
Your Next Move
Step 1: Identify your available startup capital and match it to the right model using the framework above. Don’t stretch — undercapitalization is the #1 reason food businesses fail.
Step 2: Research your local market. What’s the commissary kitchen rental rate in your area? What are food truck permit costs? What does ghost kitchen space cost? Local numbers trump national averages every time.
Step 3: Build your financial model in the DDH Revenue Calculator using your actual local costs, run multiple scenarios, and find the model that produces a livable income with a capital investment you can actually make.
Related Articles
- Side Hustle Income & Tax Tracker (Free Tool)
- How Sinking Funds Saved Me From Financial Emergencies
- Freelancer Finance Dashboard
Keep reading (related guides):
255+ interactive tools for your money, time, and health.
Full features for 14 days · Secure payment · Stop anytime
Andy Gaber is the founder of Digital Dashboard Hub, a suite of 255+ interactive financial, productivity, and wellness tools. He built DDH after getting frustrated with financial apps that gave outputs without context. Follow along for tool tutorials, revenue analytics breakdowns, and honest takes on personal finance.