You’ve Googled This Number Before — Let’s Make It Real
Before DDH, I was doing this manually in spreadsheets. Here’s the faster way:
There’s a specific dollar amount that would let you walk away from work forever. Not “someday” money. Not “if I win the lottery” money. A real, calculable number based on your actual spending. And most people never sit down and figure out what it is — because the answer feels either impossibly large or surprisingly reachable, and both are uncomfortable.
I ran my own numbers three years ago and it changed how I think about every financial decision. Not because I quit my job the next day, but because I finally had a target instead of a vague hope. Here’s how to find yours.
The 25x Rule: Your Starting Point
The math is simpler than Wall Street wants you to believe. Take your annual spending, multiply by 25. That’s your “never work again” number at a 4% withdrawal rate. The 4% rule comes from the Trinity Study — a portfolio of stocks and bonds historically survives 30+ years of withdrawals at this rate with a 95%+ success rate.
But here’s the thing most FIRE blogs gloss over: your age matters enormously. Someone retiring at 65 needs their money to last 25-30 years. Someone walking away at 35 needs it to last 50-60 years. That changes everything.
Safe Withdrawal Rates by Retirement Age
Notice the jump between retiring at 35 vs. 55. You don’t just need more time to save — you need a bigger pile because it has to last longer. A 35-year-old retiree spending $50,000/year needs $1.43 million. A 55-year-old with the same spending needs $1.25 million. That $180K gap is the price of 20 extra years of freedom.
Real Numbers at Every Spending Level
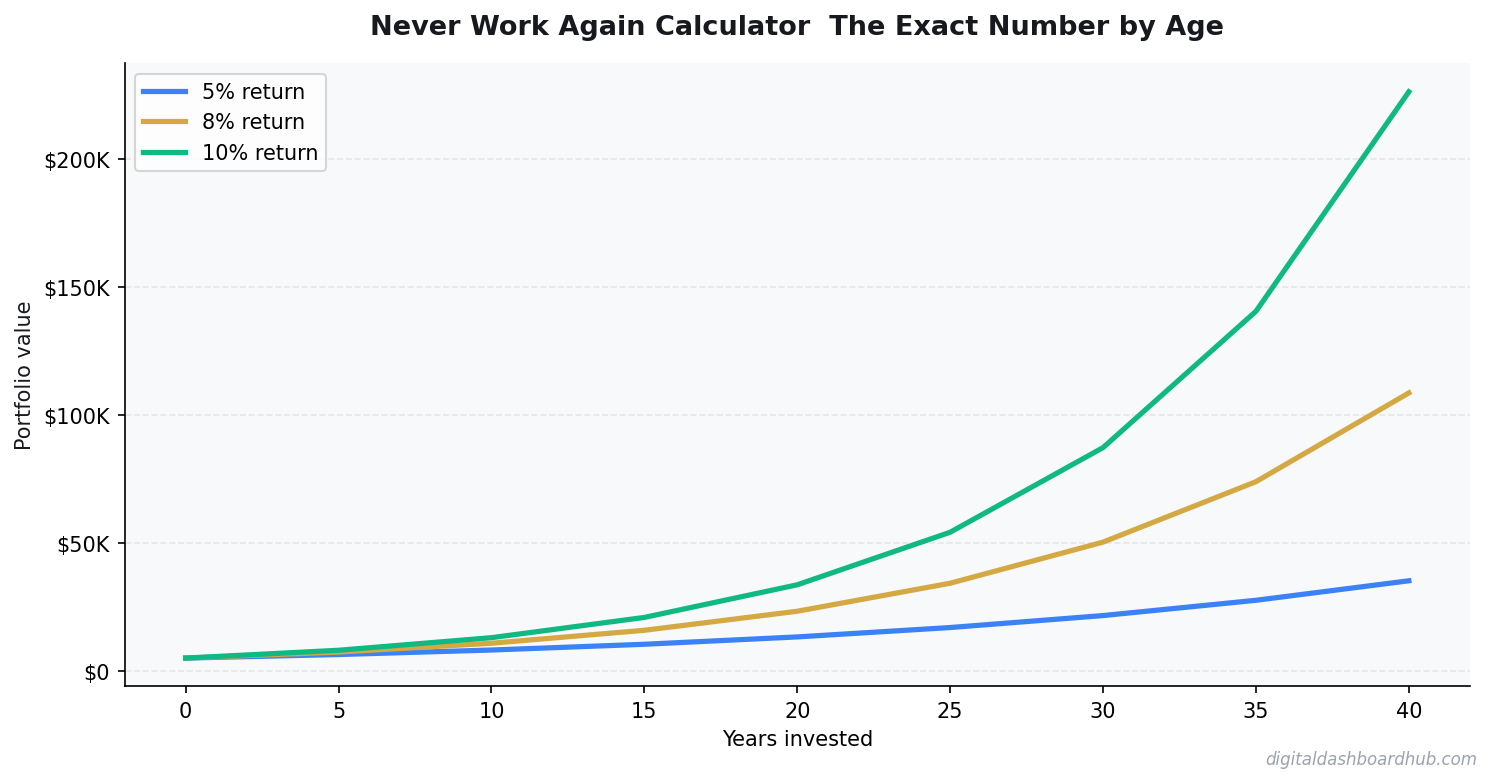
Let’s kill the abstraction. Here are the actual portfolio targets for common annual spending levels, using age-adjusted withdrawal rates:
The Three Levers You Actually Control
1. Cut Your Spending (Biggest Impact)
Every $1,000 you cut from annual spending reduces your target by $25,000-$31,000 depending on your age. That $200/month gym membership you never use? Cutting it drops your number by $60K-$74K. This is why spending matters more than income for early retirement math.
2. Increase Your Savings Rate
At a 20% savings rate, you’ll work about 37 years before you can stop. At 50%, it’s roughly 17 years. At 70%, it’s about 8.5 years. The relationship isn’t linear — every percentage point matters more as you go higher.
3. Earn More (But Only If You Save the Difference)
A raise only helps if you save the entire increase. If you earn $10K more and spend $10K more, your “never work again” number actually goes up, not down. Lifestyle inflation is the silent killer of early retirement plans.
What Most Calculators Get Wrong
I’ve tested a dozen retirement calculators and most of them ignore three critical factors:
- Healthcare before Medicare (age 65): Budget $500-$1,500/month per person for ACA marketplace plans. This alone can add $200K-$500K to your target.
- Sequence of returns risk: A market crash in your first 5 years of retirement is far more dangerous than one in year 20. A 3.25-3.5% withdrawal rate for early retirees accounts for this.
- Inflation: $50K/year today is roughly $90K in 25 years at 2.5% inflation. Your portfolio needs to grow to keep pace — which is why you still need stock market exposure even after you stop working.
Want a personalized breakdown? The Digital Dashboard Hub retirement calculator factors in your specific age, spending, tax situation, and healthcare costs — not just the generic 25x rule. Sign up for a free trial and plug in your real numbers.
The Part Nobody Talks About: Do You Actually Want to Never Work?
I know people who hit their number and kept working anyway. Not because they needed to, but because “never work again” turned out to mean “never do work I hate again.” The goal isn’t necessarily zero work — it’s zero mandatory work. That’s a different calculation emotionally, even if the math is the same.
The number gives you options. What you do with those options is a separate question entirely.
Where to Go From Here
- Right now: Calculate your actual annual spending (not what you think it is — pull 3 months of bank statements and multiply by 4). Then multiply by the age-adjusted factor from the table above.
- This week: Run the numbers through a detailed retirement calculator that accounts for taxes, healthcare, and inflation. The gap between your current savings and your target number is your roadmap.
- Long game: Focus on savings rate over everything else. Track it monthly. A 1% improvement in savings rate can shave a full year off your working timeline.
Over 1,200 people have used our retirement planning tools this month to find their number. Most were surprised — some by how large it was, others by how close they already were. Either way, knowing beats guessing. Try the calculator free.
The Exact Number: A Real Example by Age
The standard formula is your annual expenses divided by 0.04 (the “4% safe withdrawal rate” from the Trinity Study). But let me make it concrete for three ages.
Age 35, spending $48,000/year: Needs $1,200,000 invested. At 35, with 60 years of potential retirement ahead, I’d actually recommend modeling a 3.5% withdrawal rate — $1,370,000. The Trinity Study was built on 30-year retirements. 60-year retirements change the math.
Age 45, spending $60,000/year: Needs $1,500,000 at 4%, or $1,714,000 at 3.5%. At 45, Social Security at 67 becomes a real input — $1,500/month in SS benefits effectively reduces the portfolio need by $450,000 (using the same 4% math in reverse). Factor it in; most people don’t.
Age 55, spending $75,000/year: Needs $1,875,000 at 4%. But healthcare before Medicare (ages 55–65) typically adds $800–$1,500/month in expenses that aren’t reflected in current spending. Add $200,000–$300,000 to any pre-Medicare retirement number to cover the healthcare gap.
What Most People Get Wrong About This Number
The number is not the hard part. Closing the gap between your current portfolio and that number — that’s where people get tripped up.
The most powerful variable is savings rate, not investment returns. Going from a 15% savings rate to a 25% savings rate cuts your time to financial independence by roughly 8–10 years, depending on starting point. A 2% improvement in investment returns cuts it by 3–4 years. What you save matters more than how you invest it. Most financial media focuses on investment returns because it’s more interesting content. Your behavior is the actual lever.
Keep reading (related guides):
- How Much Money You Need to Retire Early at 40, 45, and 50 (Real Numbers by Age)
- The Exact Number You Need to Never Work Again — By Age (How to Calculate It)
- How to Calculate Your Net Worth (And Why Its the Only Financial Number That Matters)
- Investing for Beginners: How to Start With Just $50 (And Actually Understand What Youre Doing)
- Bakery Revenue Calculator
255+ interactive tools for your money, time, and health.
Instant signup · Stripe-secure · Cancel in one click
Keep Reading
- How Much Money to Retire Early by Age
- Freelancer Finance Dashboard: Track Income, Taxes, and Cash Flow
- How Sinking Funds Saved Me From Financial Emergencies
Common Questions About Never Work Again Calculator: The Exact Number by Age
How long does it take to see results?
Most people see meaningful progress within 30-90 days when they apply these strategies consistently. The key is tracking your numbers from day one so you have a baseline to measure against.
What’s the biggest mistake people make?
Trying to do everything at once. Pick one or two strategies from this guide, implement them fully, then layer in additional tactics. Spreading yourself thin is the fastest way to see no results from any of it.
Do I need special tools or software?
Not necessarily to start — but the right tools eliminate hours of manual work. Our free calculators and trackers at Digital Dashboard Hub are a good starting point before you invest in paid software.

Andy Gaber is the founder of Digital Dashboard Hub, a suite of 255+ interactive financial, productivity, and wellness tools. He built DDH after getting frustrated with financial apps that gave outputs without context. Follow along for tool tutorials, revenue analytics breakdowns, and honest takes on personal finance.