Here’s a free hvac business tool that actually works — no signup, no email capture wall, no “results hidden behind paywall” nonsense. Enter your numbers below and get instant results. If you want the full version with charts and reports, that’s available too.
Use the Free HVAC Business Tool
Scroll down — the interactive tool runs live with your inputs. Full version lives inside Digital Dashboard Hub. Two-click trial, Stripe-secure.
Why This Tool Exists
Most free tools online are either broken, outdated, or just a landing page pretending to be a tool. I wanted something that gives you a real answer in under 60 seconds — no account required, no friction. The tool below does exactly that.
If you need more depth — historical tracking, scenario comparison, PDF exports — the full version inside Digital Dashboard Hub covers all of that. But the lite version below handles the basics right now.
The Full Dashboard Experience
| Approach | Startup Cost | Time Investment | Revenue Potential | Best For |
|---|---|---|---|---|
| Solo operator | Low ($1K-$10K) | Full time | $60K-$200K/yr | Maximum margins, full control |
| Small team (2-5) | Medium ($10K-$50K) | Management + some fieldwork | $200K-$800K/yr | Scaling without losing control |
| DDH Revenue Tracker | Free trial | 5 min setup | N/A (profit tool) | Know your real numbers in real time |
The lite tool above gives you a quick answer. The full HVAC Business Revenue Calculator inside Digital Dashboard Hub goes way deeper:
- Historical tracking — log your numbers weekly and watch trends emerge over months
- Visual charts — bar graphs, trend lines, and breakdowns that make patterns impossible to miss
- Scenario modeling — run “what if” comparisons side by side before making decisions
- PDF reports — export clean reports for partners, lenders, or your own records
- — one subscription covers every calculator and tracker in the library
Three Steps to Useful Numbers
Step 1: Enter your real numbers above. Estimates work, but real data from your bank statements or business records gives you something you can actually act on.
Step 2: Change one variable at a time and watch what happens. You’ll quickly see which lever moves your results the most — that’s where to focus your energy.
Step 3: If you want to save these results or track them over time, start a free 14-day trial of the full dashboard. No credit card required. Cancel anytime.
What to Do Next
- Right now (30 seconds): Bookmark this page so you can rerun the numbers next month
- This week: Gather your actual data and run it through the tool with real numbers instead of estimates
- Long game: Try the full DDH dashboard — 261 tools, 14 days free, cancel anytime
Related Tools and Articles
- The True Cost of a Mortgage vs. The True Cost of Renting: A 30-Year Analysis
- ADHD Daily Routine Planner: How to Build Structure That Works With Your Brain (Not Against It)
- How a Gratitude Journal Rewires Your Brain for Happiness (And the Right Way to Keep One)
Common Questions About Free HVAC Business Revenue Calculator — Estimate Your Profit in 60 Seconds
How long does it take to see results?
Most people see meaningful progress within 30-90 days when they apply these strategies consistently. The key is tracking your numbers from day one so you have a baseline to measure against.
What’s the biggest mistake people make?
Trying to do everything at once. Pick one or two strategies from this guide, implement them fully, then layer in additional tactics. Spreading yourself thin is the fastest way to see no results from any of it.
Do I need special tools or software?
Not necessarily to start — but the right tools eliminate hours of manual work. Our free calculators and trackers at Digital Dashboard Hub are a good starting point before you invest in paid software.
Real HVAC Revenue Math: A Worked Example
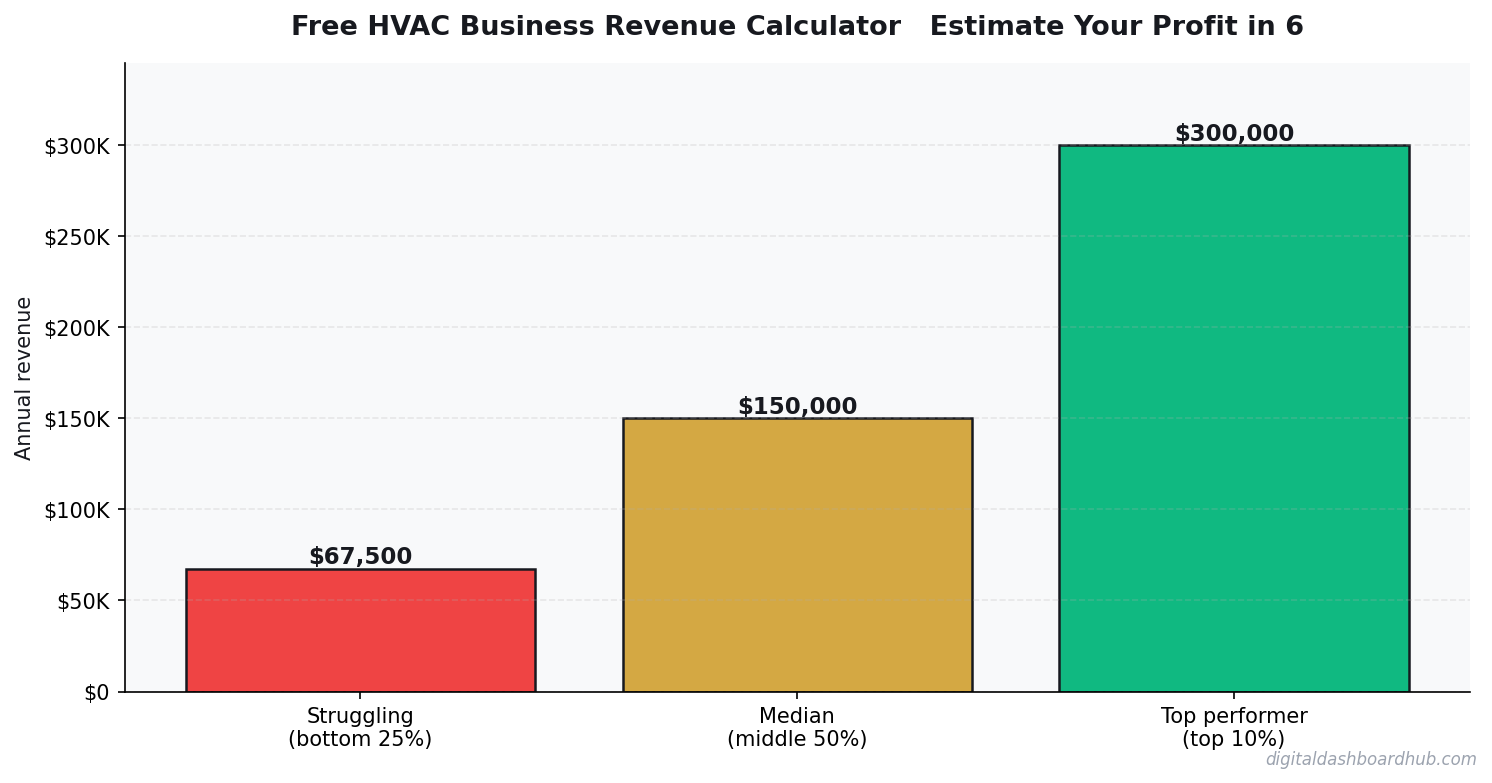
Let’s look at a mid-sized HVAC company in a suburban market — say Nashville, Tennessee. Two technicians, one service van each. Here’s what the numbers can actually look like.
Each tech does 4-5 service calls per day at an average ticket of $280 (mix of diagnostics, minor repairs, and maintenance agreements). That’s $1,120-$1,400/day per tech, or $2,240-$2,800/day for the shop. At 250 working days per year (accounting for holidays, weather, and slow weeks), gross revenue runs $560K-$700K.
Net profit after labor ($180K for two techs + owner draw), van costs, parts, insurance, and overhead typically lands at 12-18% for a well-run HVAC shop. On $630K gross, that’s $75K-$113K in owner profit — before accounting for equipment loans or expansion costs.
The 3 Factors That Move HVAC Revenue Most
1. Maintenance agreement base. A recurring maintenance agreement at $180/year converts a one-time customer into guaranteed annual revenue. A shop with 400 active maintenance agreements has $72,000 in predictable revenue before anyone picks up the phone in January. That floor changes everything about how you staff and plan.
2. Average ticket vs. call volume. Most HVAC owners focus on booking more calls. The better lever is average ticket. Moving from $220 average ticket to $290 (through better diagnostics, presenting repair vs. replace options, and selling IAQ add-ons) has the same revenue impact as booking 32% more calls — without the scheduling headache.
3. Geographic density of calls. Drive time is dead time. A shop running 5 calls/day spread across 30 miles will always underperform one running 5 calls across 10 miles, because the denser operation gets more billable hours per day. Targeting one or two zip codes heavily is almost always more profitable than spreading across a metro area.
What the Calculator Doesn’t Show You (But You Need to Know)
Seasonality is brutal in HVAC. Summer and winter are feast; spring and fall are famine. The shops that survive long-term have either built a large enough maintenance base to smooth the curve, diversified into commercial HVAC (more consistent year-round), or aggressively use shoulder-season pricing to keep techs busy.
The other number worth watching: parts markup. Most HVAC companies mark up parts 30-50%. Some mark up 100% or more on emergency calls. There’s no universal standard, but your parts gross margin should be tracked separately from your labor margin — because they behave differently and require different pricing strategies.
HVAC Maintenance Agreements: The Revenue Engine Most Shops Underinvest In
A maintenance agreement is a recurring contract where a customer pays annually for two seasonal tune-ups — typically $180-$350 per year depending on market and system complexity. At 200 active agreements, a shop has $36,000-$70,000 in guaranteed annual revenue before a single service call comes in. That floor changes everything about how you staff, what slow seasons look like, and how you make hiring decisions.
The math on maintenance agreements is exceptional. The labor cost per visit runs $35-$55 (one technician hour), plus $15-$25 in parts and filters. On a $250/year agreement with two visits, you’re netting roughly $110-$140 per agreement per year — and that’s before accounting for the repair and replacement work that agreements generate. Customers with maintenance agreements are 3-4x more likely to call your shop first when their system fails, because you’ve already established a relationship and they trust you. That trust converts to the high-margin repair and replacement work that actually drives HVAC profitability.
Most HVAC shops have far fewer maintenance agreements than they could. The primary barrier is that selling agreements requires a different motion than booking service calls — it’s a relationship sale that happens over time, usually during a tune-up or repair visit. The techs doing the work are often the best salespeople for agreements, but most shops don’t give them the training or commission structure to sell them consistently. A $15-25 commission per agreement sold to a tech who just finished a tune-up is one of the highest-ROI sales investments a shop can make.
The calculator’s recurring revenue section models your agreement base at different penetration rates. Most shops are surprised to see what 150 versus 300 agreements does to annual revenue and profit — not because the per-agreement margin is huge, but because the predictability changes the entire operational model.
Keep reading (related guides):
14 days free · No charge today · 2-click cancel
What Most People Get Wrong
The single biggest mistake is treating revenue as the headline number. Revenue is vanity — margin is sanity, and cash-in-bank is reality. Two operators with identical top-lines routinely end the year $80K apart in take-home, because one priced for volume and the other priced for sustainability. The calculator above forces you to surface that gap before it hits your bank account.
The second mistake is modeling a “best case” and planning around it. The number you should plan around is the 30th-percentile scenario — enough demand to matter, but slower than you hoped. If the business still covers your living expenses there, you have real margin of safety. If it only works in the 80th-percentile case, you are building on sand.
The third mistake is ignoring your time as a cost. If you would otherwise earn $55/hr at a day job and this operation pays you effectively $18/hr for 60-hour weeks, the gap is the real price of running it. Plug your opportunity cost into the calculator and the picture often flips.
How to Pressure-Test Your Numbers
Start with the calculator, then stress-test three levers independently:
- Pricing: What happens to your take-home if you raise prices 10%, but lose 15% of volume? Most operators are surprised to find net income goes up.
- Costs: What happens if your largest input cost rises 20%? This is not hypothetical — it is a typical 12-month swing in most industries.
- Volume: What happens at 70% of your planned volume for 90 days? If that still covers fixed costs, you have a real business. If not, the model is fragile.
Running the calculator three ways takes about ten minutes. The clarity on the other side of those ten minutes is usually the difference between a confident operating plan and guessing for another six months.
Frequently Asked Questions
How accurate is this calculator?
The underlying math uses industry-standard margin and cost ranges sourced from the Free HVAC Business Revenue Calculator — Estimate Your Profit in 60 Seconds space. Your actual numbers depend on location, seasonality, and operating style, so treat this as a directional benchmark, not a guarantee. The more precisely you enter your inputs, the tighter the output range becomes.
Can I save my results?
A free Digital Dashboard Hub account saves every scenario you run, lets you compare side-by-side, and unlocks the full dashboard with expense tracking and month-over-month charts. The 14-day trial includes the complete tool library — no credit card required to start.
Who is this tool for?
It’s built for anyone pressure-testing a real decision — existing operators auditing their margins, side-hustlers deciding whether to go full-time, and prospective owners trying to sanity-check a business plan before signing a lease. You do not need any accounting background to use it.
What should I do with the results?
Start by comparing the output against your current (or projected) monthly take-home. If the gap is big, walk back the inputs and identify which lever — pricing, volume, or cost structure — is doing the damage. That is usually where the highest-leverage fix lives.
The Bottom Line
Most operators lose money not because the math is impossible, but because they never actually ran it. Fifteen minutes with the calculator beats three months of guessing. Run your numbers, screenshot the output, and use it as the baseline for every pricing and cost decision over the next quarter.
When you are ready to go deeper, the full Digital Dashboard Hub workspace lets you save scenarios, track actuals month-over-month, and see the trend before problems compound. That is the version that actually compounds the effort — spreadsheets forgotten in a Google Drive folder do not.
Next Steps
- Run the calculator above with your best current estimates.
- Re-run it with a pessimistic scenario (lower volume, higher costs) and a stretch scenario (better pricing, more efficient ops).
- Screenshot all three outputs so you have a baseline to compare against when reality arrives.
- Revisit monthly — the number that matters is the one that changes with your real P&L.
Ready for the full dashboard?
Unlock all 255 tools across business, creator, and health workflows.
Andy Gaber is the founder of Digital Dashboard Hub, a suite of 255+ interactive financial, productivity, and wellness tools. He built DDH after getting frustrated with financial apps that gave outputs without context. Follow along for tool tutorials, revenue analytics breakdowns, and honest takes on personal finance.