Everyone talks about jewelry business revenue. Nobody talks about what actually lands in your pocket after rent, payroll, supplies, and taxes eat their share. That gap between gross revenue and take-home pay is where most people get blindsided.
About this article: I’m Andy, founder of Digital Dashboard Hub. I built DDH’s 255 free interactive tools to solve the specific financial, productivity, and wellness tracking gaps I kept seeing — starting with the problem this article covers. The free tool below is available without signup and works instantly. Try it and see your numbers in real time.
Use the Free Jewelry Business Tool
Scroll down — the interactive tool runs live with your inputs. Full version lives inside Digital Dashboard Hub. Two-click trial, Stripe-secure.
What Jewelry Business Owners Actually Take Home
The average independent jeweler does $350K-$500K/year with a 45% gross margin, but after rent in a retail location ($3K-$8K/month), labor, and insurance on inventory, net margins drop to 10-15%.
Custom pieces carry 60%+ margins vs. 35% on commodity items. The mix matters more than volume.
The Numbers Behind the Numbers
| Approach | Startup Cost | Time Investment | Revenue Potential | Best For |
|---|---|---|---|---|
| Solo operator | Low ($1K-$10K) | Full time | $60K-$200K/yr | Maximum margins, full control |
| Small team (2-5) | Medium ($10K-$50K) | Management + some fieldwork | $200K-$800K/yr | Scaling without losing control |
| DDH Revenue Tracker | Free trial | 5 min setup | N/A (profit tool) | Know your real numbers in real time |
The biggest line item? Materials (gold, silver, gemstones) eat 30-40% of revenue before you touch labor.
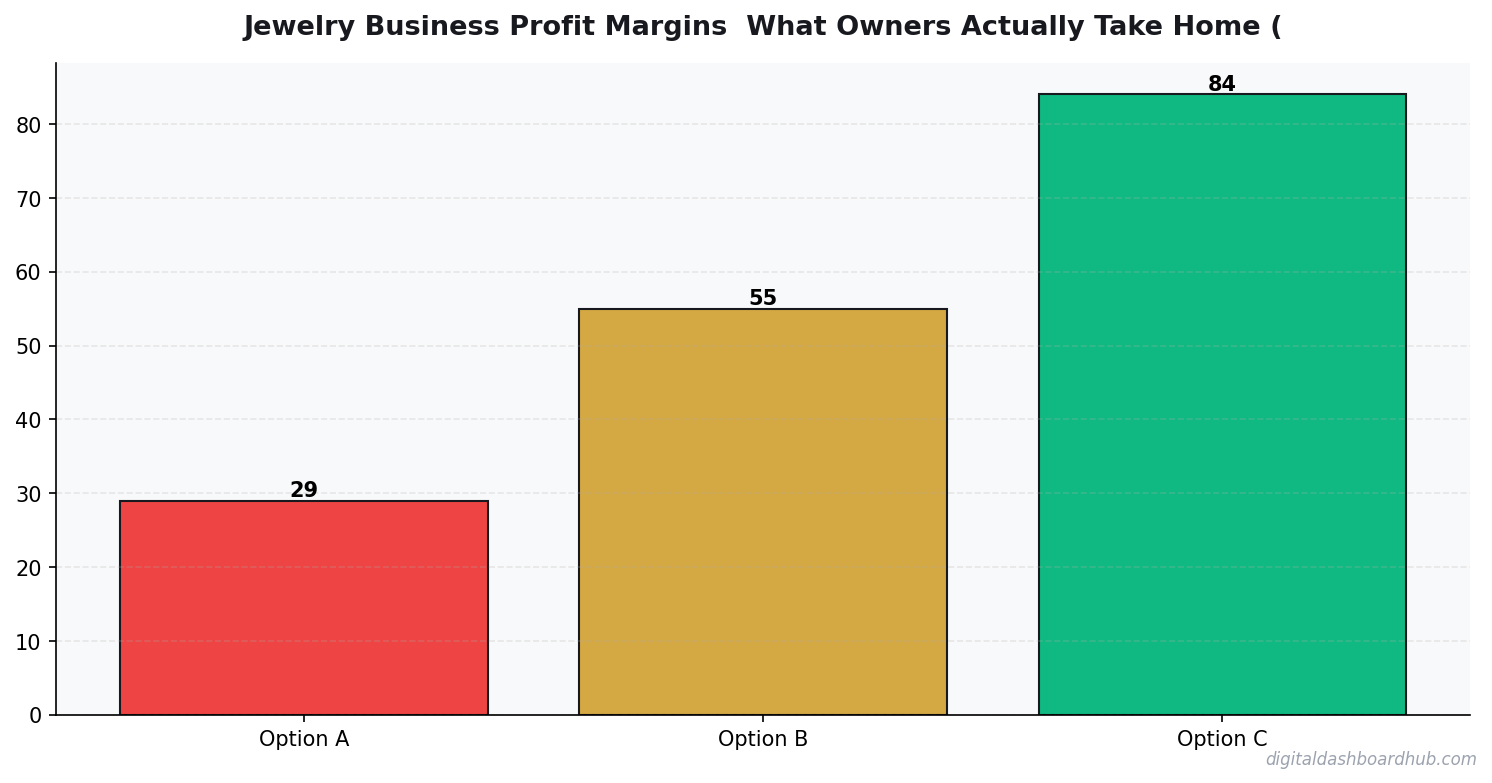
Shifting from wholesale commodity to custom/bespoke work is the single biggest margin lever — one custom engagement ring at $5K with 65% margin beats ten $200 chain necklaces at 30%.
The Mistake That Costs You the Most
Most jewelers underestimate insurance costs. You’re sitting on $50K-$200K of inventory — that’s $300-$800/month in coverage alone.
December accounts for 25-30% of annual revenue. If your cash flow can’t survive January-March, the holiday rush won’t save you.
The Dashboard Behind This Calculator
The lite tool above gives you a quick answer. The full Jewelry Business Revenue Calculator inside Digital Dashboard Hub goes way deeper:
- Historical tracking — log your numbers weekly and watch trends emerge over months
- Visual charts — bar graphs, trend lines, and breakdowns that make patterns impossible to miss
- Scenario modeling — run “what if” comparisons side by side before making decisions
- PDF reports — export clean reports for partners, lenders, or your own records
- 255+ interactive tools included — one subscription covers every calculator and tracker in the library
Turn These Numbers Into Action
Step 1: Enter your real numbers above. Estimates work, but real data from your bank statements or business records gives you something you can actually act on.
Step 2: Change one variable at a time and watch what happens. You’ll quickly see which lever moves your results the most — that’s where to focus your energy.
Step 3: If you want to save these results or track them over time, start a free 14-day trial of the full dashboard. No credit card required. Cancel anytime.
Your Next Move
- Right now (30 seconds): Bookmark this page so you can rerun the numbers next month
- This week: Gather your actual data and run it through the tool with real numbers instead of estimates
- Long game: Try the full DDH dashboard — 261 tools, 14 days free, cancel anytime
Related Tools and Articles
- Micro-Business Operations Dashboard (CSL): Your All-in-One Command Center for Running a Lean Business
- Why People with ADHD Start Everything and Finish Nothing (And 7 Systems That Actually Help)
- How Journaling Rewires an Anxious Brain: A Science-Backed Guide
Common Questions About Jewelry Business Profit Margins: What Owners Actually Take Home (2026)
How long does it take to see results?
Most people see meaningful progress within 30-90 days when they apply these strategies consistently. The key is tracking your numbers from day one so you have a baseline to measure against.
What’s the biggest mistake people make?
Trying to do everything at once. Pick one or two strategies from this guide, implement them fully, then layer in additional tactics. Spreading yourself thin is the fastest way to see no results from any of it.
Do I need special tools or software?
Not necessarily to start — but the right tools eliminate hours of manual work. Our free calculators and trackers at Digital Dashboard Hub are a good starting point before you invest in paid software.
Keep reading (related guides):
- Auto Mechanic Revenue: What Owners Make vs. What Youd Expect (2026)
- Boutique Revenue Calculator
- Car Affordability Calculator: How Much Car Can You Actually Afford?
- Window Cleaning Revenue Calculator: Residential vs Commercial Profit
- Rent vs. Buy Calculator 2026: The True Cost of Each Option (Real Numbers)
255+ interactive tools for your money, time, and health.
14 days free · No charge today · 2-click cancel
What Most People Get Wrong
The single biggest mistake is treating revenue as the headline number. Revenue is vanity — margin is sanity, and cash-in-bank is reality. Two operators with identical top-lines routinely end the year $80K apart in take-home, because one priced for volume and the other priced for sustainability. The calculator above forces you to surface that gap before it hits your bank account.
The second mistake is modeling a “best case” and planning around it. The number you should plan around is the 30th-percentile scenario — enough demand to matter, but slower than you hoped. If the business still covers your living expenses there, you have real margin of safety. If it only works in the 80th-percentile case, you are building on sand.
The third mistake is ignoring your time as a cost. If you would otherwise earn $55/hr at a day job and this operation pays you effectively $18/hr for 60-hour weeks, the gap is the real price of running it. Plug your opportunity cost into the calculator and the picture often flips.
How to Pressure-Test Your Numbers
Start with the calculator, then stress-test three levers independently:
- Pricing: What happens to your take-home if you raise prices 10%, but lose 15% of volume? Most operators are surprised to find net income goes up.
- Costs: What happens if your largest input cost rises 20%? This is not hypothetical — it is a typical 12-month swing in most industries.
- Volume: What happens at 70% of your planned volume for 90 days? If that still covers fixed costs, you have a real business. If not, the model is fragile.
Running the calculator three ways takes about ten minutes. The clarity on the other side of those ten minutes is usually the difference between a confident operating plan and guessing for another six months.
Frequently Asked Questions
How accurate is this calculator?
The underlying math uses industry-standard margin and cost ranges sourced from the Jewelry Business Profit Margins: What Owners Actually Take Home space. Your actual numbers depend on location, seasonality, and operating style, so treat this as a directional benchmark, not a guarantee. The more precisely you enter your inputs, the tighter the output range becomes.
Can I save my results?
A free Digital Dashboard Hub account saves every scenario you run, lets you compare side-by-side, and unlocks the full dashboard with expense tracking and month-over-month charts. The 14-day trial includes the complete tool library — no credit card required to start.
Who is this tool for?
It’s built for anyone pressure-testing a real decision — existing operators auditing their margins, side-hustlers deciding whether to go full-time, and prospective owners trying to sanity-check a business plan before signing a lease. You do not need any accounting background to use it.
What should I do with the results?
Start by comparing the output against your current (or projected) monthly take-home. If the gap is big, walk back the inputs and identify which lever — pricing, volume, or cost structure — is doing the damage. That is usually where the highest-leverage fix lives.
The Bottom Line
Most operators lose money not because the math is impossible, but because they never actually ran it. Fifteen minutes with the calculator beats three months of guessing. Run your numbers, screenshot the output, and use it as the baseline for every pricing and cost decision over the next quarter.
When you are ready to go deeper, the full Digital Dashboard Hub workspace lets you save scenarios, track actuals month-over-month, and see the trend before problems compound. That is the version that actually compounds the effort — spreadsheets forgotten in a Google Drive folder do not.
Next Steps
- Run the calculator above with your best current estimates.
- Re-run it with a pessimistic scenario (lower volume, higher costs) and a stretch scenario (better pricing, more efficient ops).
- Screenshot all three outputs so you have a baseline to compare against when reality arrives.
- Revisit monthly — the number that matters is the one that changes with your real P&L.
What the Numbers Actually Mean
Revenue, profit, and take-home pay tell three completely different stories, and conflating them is the fastest way to build a business plan that blows up on contact with reality. Revenue is the gross — what shows up on invoices and receipts before anyone pays anyone else. Profit is what remains after the cost of actually producing the service or product. Take-home is what lands in your personal account after taxes, self-employment contributions, benefits, and reinvestment.
The calculator above is specifically tuned to show the delta between those three layers, because that delta is where most operators get blindsided. A business can look like it is doing $400K/year and still pay its owner less than a middle-manager’s salary if the cost structure is wrong. Conversely, a modest $180K/year operation with disciplined costs can out-earn the flashy one in actual cash delivered to the owner’s household.
When you run your scenario, pay the most attention to the “after taxes and reinvestment” line rather than the top-line number. That is the line that determines whether this is a real livelihood or a time-expensive hobby that looks successful on Instagram.
Using the Tool With Your Own Data
The calculator delivers the most honest answer when you plug in real numbers from the last 90 days rather than aspirational ones. If you do not have 90 days of data yet, use the lowest plausible input for volume, the highest plausible input for each cost, and then run it again with your “most likely” estimates. The gap between those two runs is your planning buffer — that is the margin you have before you are in trouble.
Operators who do this exercise quarterly tend to outperform operators who only run the numbers once at the start and then reference outdated assumptions for the next 18 months. Markets change, input costs change, and your own operational efficiency changes. A static plan is a decaying one. Ten minutes with the calculator every quarter is enough to catch most problems while there is still runway to fix them.
If you are comparing two different business models or two pricing strategies, duplicate the scenario, change one variable, and compare. Isolating a single lever is how you learn which change actually moved the needle — this is the same approach good product teams use for A/B tests, and it applies to running a small business just as cleanly.
When to Revisit This
Come back to the calculator whenever one of these things changes: your pricing, your largest input cost, your volume (up or down by more than 20%), or your tax situation. Each of those variables moves the take-home line enough that the plan you had last quarter may no longer be the plan you need this quarter. Put a recurring 30-minute block on your calendar for the first week of every quarter and run the scenario fresh — it is the single highest-leverage business habit you can build.
Save your screenshots in a single folder labeled by date so you can see the trend across time. That folder becomes a ruthless honesty mirror when you are tempted to invest in growth spending or take on new fixed costs — does the next quarter actually support that move, or is it wishful thinking?
Ready for the full dashboard?
Unlock all 255 tools across business, creator, and health workflows.
Andy Gaber is the founder of Digital Dashboard Hub, a suite of 255+ interactive financial, productivity, and wellness tools. He built DDH after getting frustrated with financial apps that gave outputs without context. Follow along for tool tutorials, revenue analytics breakdowns, and honest takes on personal finance.