Every real estate investor has looked at a listing and thought, “this could work.” The math in their head says yes. The actual math — when you account for vacancy, maintenance, property management, insurance, and taxes — often says something different.
The DDH Rental Property ROI Calculator runs the real numbers: cash-on-cash return, cap rate, net operating income, monthly cash flow, and your break-even timeline. Before you make an offer, you’ll know if the deal actually pencils out.
What “ROI” Actually Means for Rental Property
Rental property has four distinct return streams, and most beginner investors only track one.
Cash flow — what hits your account monthly after mortgage, expenses, and vacancies.
Equity paydown — your tenant is paying down your mortgage each month. On a $300,000 property, that’s roughly $3,000–4,000/year in equity built without you writing a check.
Appreciation — historically 3-4% annually for US real estate, though highly market-dependent and the least reliable of the four.
Tax benefits — depreciation alone can shelter thousands of dollars in rental income from taxes each year.
The rental property ROI calculator quantifies all four and shows your total return, not just your monthly cash flow number.
What the Calculator Shows
Enter your property details and the calculator outputs:
- Monthly cash flow (gross rent minus all expenses)
- Annual cash-on-cash return (cash flow / cash invested)
- Cap rate (NOI / property value)
- Gross rent multiplier (quick sanity check)
- Break-even occupancy rate
- 5-year and 10-year equity projection
The Expenses Most Investors Forget
| Expense | Typical Range | Default |
|---|---|---|
| Vacancy | 5–10% of gross rent | 8% |
| Repairs & maintenance | 1% of property value/year | 1% |
| Property management | 8–12% of rent collected | 10% |
| Insurance | $100–200/mo | $150 |
| CapEx reserve | 5–8% of rent | 7% |
| Property tax | Varies by market | Enter manually |
Most investors use 50% of gross rent as a rough “expense ratio” for ballpark math. The calculator lets you get specific.
FREE BONUS: The Rental Property Due Diligence Checklist
37 questions to answer before you make an offer — includes the expense categories most buyers miss.
Get instant access → app.digitaldashboardhub.com/signup
How the DDH Rental Property ROI Calculator Works
Here’s a real example.
Property: 3-bedroom single family, purchase price $285,000. You’re putting 25% down ($71,250). The seller is claiming $2,100/month rent.
Step 1: Enter the purchase price, down payment, and your financing terms (7.25% on a 30-year investment loan). Mortgage payment comes out to $1,575/month.
Step 2: Enter the gross rent: $2,100/month. Apply the expense defaults:
- Vacancy (8%): -$168
- Property management (10%): -$210
- Repairs (1% of value/year): -$238/mo
- Insurance: -$150
- CapEx reserve (7%): -$147
Step 3: The calculator shows effective monthly income of $1,187 after expenses, mortgage payment of $1,575, and monthly cash flow of -$388.
This deal loses $388/month. The listing agent’s math ignored vacancy, management, and reserves. The rental property ROI calculator caught it in 3 minutes.
Adjust the assumptions — maybe you self-manage (save $210/mo) and put 30% down (lower payment). Suddenly you’re at $47/month positive cash flow. Thin, but possible. Now you have an informed negotiation position.
→ Try the DDH Rental Property ROI Calculator free: app.digitaldashboardhub.com/signup
Why the 50% Rule Exists (and When It Fails You)
You’ve probably heard the “50% rule” for rental properties: assume 50% of gross rent goes to expenses (not counting mortgage). On a property renting for $2,000/month, that’s $1,000/month in expenses.
It’s a useful rough-cut — it exists because most landlords underestimate maintenance, vacancy, and CapEx. The rule protects you from optimistic math.
But here’s when it breaks down:
- Brand new construction — maintenance costs in years 1-5 are dramatically lower than a 30-year-old house. The 50% rule overestimates expenses here.
- High-rent markets — in a market where rent is $4,000/month, the 50% rule implies $2,000/month in expenses. But insurance doesn’t scale with rent, and a $100/month repair is the same whether rent is $1,000 or $4,000. The rule overcorrects in high-rent markets.
- Self-managed properties nearby — if you manage yourself and the property is 10 minutes from your house, you eliminate the 8-12% property management fee. That changes the math significantly.
The DDH calculator lets you enter your actual expense estimates instead of relying on the rule of thumb. Use the 50% rule to filter out bad deals quickly. Use the calculator to analyze the deals that survive the filter.
Market Benchmarks: What “Good” Looks Like by Location
Cap rates and cash-on-cash returns vary significantly by market. Here’s a rough framework for evaluating deals in different markets:
| Market Type | Typical Cap Rate | Cash-on-Cash Target | Growth Tradeoff |
|---|---|---|---|
| Gateway cities (NYC, LA, SF) | 2-4% | 1-4% | Betting on appreciation, not cash flow |
| Secondary cities (Austin, Denver, Nashville) | 4-6% | 4-7% | Balanced approach |
| Midwest / tertiary markets | 6-10% | 7-12% | Strong cash flow, lower appreciation |
| Distressed / value-add | 8-15% | 8-15%+ | Higher risk, higher reward if you execute |
If your deal in a primary market shows 8% cash-on-cash, something is probably off — either the rent is optimistic, the expenses are underestimated, or you’re looking at a genuinely exceptional deal. Run the numbers again with conservative assumptions before celebrating.
What Makes a Good Rental Property Deal?
Cash-on-cash return: Aim for 6–10%+ in most markets. Under 5% means you’re betting on appreciation, not cash flow.
Cap rate: 5–8% is typical for decent markets. Under 4% is appreciation play territory. Over 10% usually means high risk.
Monthly cash flow: Many investors target $200–400/door minimum after all expenses. Cash flow under $100/door leaves almost no margin for surprises.
Break-even occupancy: If your property needs 95%+ occupancy to cover expenses, one difficult tenant cycle could wipe out a year of profits.
How to Use This in a Real Negotiation
Here’s the most valuable thing the calculator does that most investors don’t use: it gives you a defensible counteroffer.
Say the seller is asking $310,000 on a property you’ve analyzed. At $310K, your cash flow is -$200/month. At $285K, you break even. At $275K, you’re at +$180/month — which meets your minimum threshold.
You go back to the seller: “Based on current market rents, realistic vacancy rates, and typical maintenance costs, the numbers work at $275,000. Here’s the analysis.” You’re not negotiating on emotion — you’re showing your work.
Sellers respond differently to a buyer with a spreadsheet than to a buyer who just says “your price is too high.” The calculator turns your offer into a conversation about math, not opinion.
Your Next Move
Right now (2 minutes): Pull a listing you’re considering and run it through the calculator with realistic expense assumptions — not the listing agent’s math.
This week: Run at least 5 properties through the calculator. The ones that look similar on paper often perform very differently when you account for local tax rates and management costs.
Long game: Track actual income and expenses in the DDH dashboard and compare to your projections.
Still here? You’re serious about real estate.
Join 1,200+ users running deals through DDH calculators before they buy.
Analyze your first deal free → app.digitaldashboardhub.com/signup
Keep reading (related guides):
- True Cost of Your Mortgage Calculator: Its More Than the Payment
- What Does a Wedding Actually Cost? 2026 Calculator With Real Data
- Wedding Budget Breakdown: Where Every Dollar Should Go (Free Calculator)
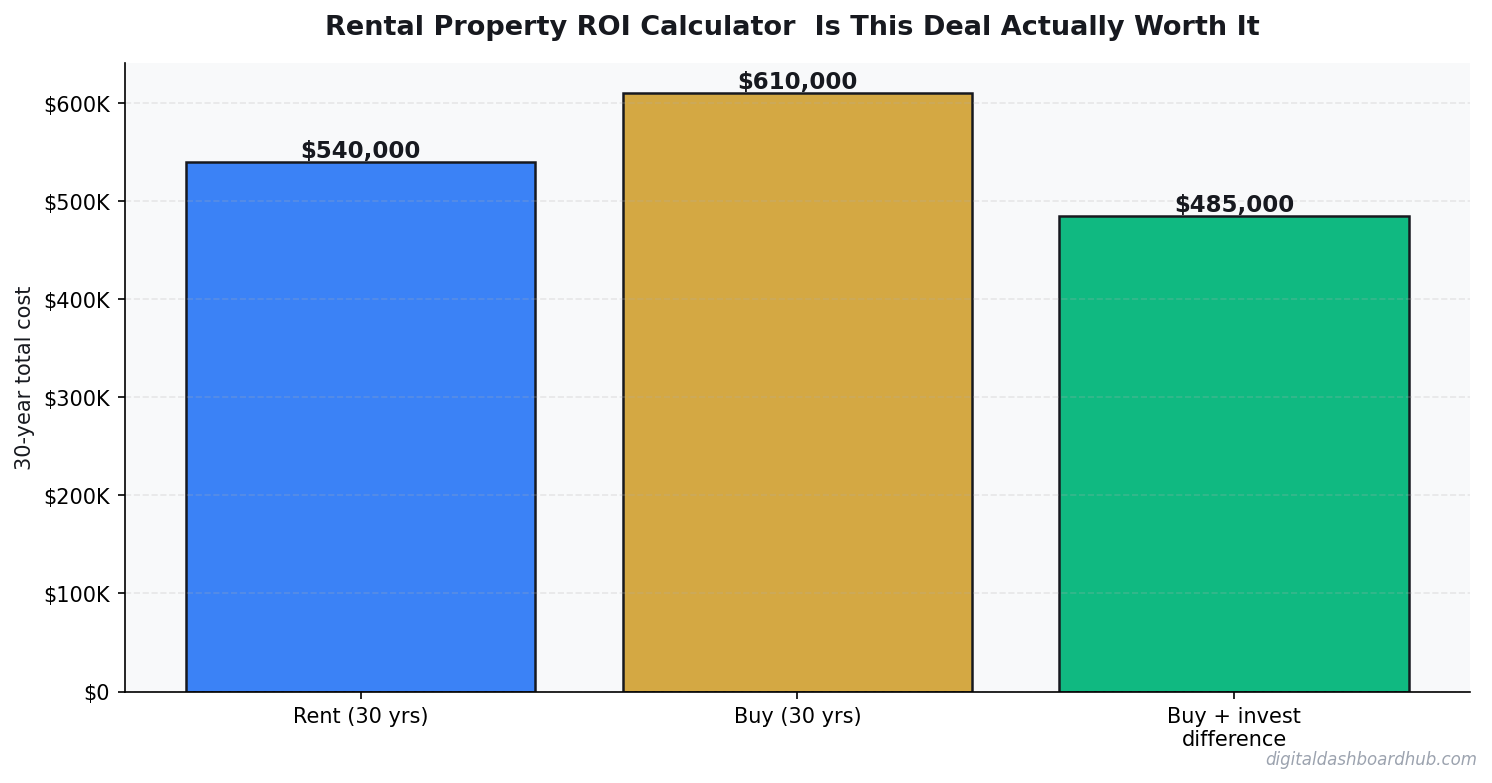
- Homeownership vs. Renting for 30 Years: The Complete Financial Comparison
- Bakery Revenue Calculator
255+ interactive tools for your money, time, and health.
Full dashboard access · Stripe-secure checkout · Cancel anytime
Keep Reading
- The Side Hustle Tax Trap: How to Track Every Dollar
- How Sinking Funds Saved Me From Financial Emergencies
- Freelancer Finance Dashboard: Track Income, Taxes, and Cash Flow
Andy Gaber is the founder of Digital Dashboard Hub, a suite of 255+ interactive financial, productivity, and wellness tools. He built DDH after getting frustrated with financial apps that gave outputs without context. Follow along for tool tutorials, revenue analytics breakdowns, and honest takes on personal finance.