
The 30-Year Question That Could Cost You $500,000 If You Get It Wrong
Before DDH, I was doing this manually in spreadsheets. Here’s the faster way:
Choosing between buying and renting isn’t a one-time decision — it’s a 30-year financial trajectory that compounds in either direction. Get the math right and you could end up half a million dollars richer. Get it wrong and you’ll spend decades paying for a decision made on bad assumptions.
I’m going to show you how to run this comparison yourself, step by step, with your own numbers. Not a simplified “multiply your rent by 200” rule — the actual comprehensive model that accounts for every variable that matters.
mortgage“>Step 1: Calculate True Monthly Ownership Cost (Not Just the Mortgage)
The mortgage payment is the headline number, but it’s usually 55-65% of your total monthly cost to own a home. Here’s how to calculate the full picture.
Mortgage principal and interest: Use any amortization calculator. For a $300,000 home with 20% down ($60,000), a $240,000 loan at 6.8% for 30 years is $1,566/month.
Property taxes: Look up your specific county’s effective tax rate at your county assessor’s website. National average is 1.1%, but it ranges from 0.31% (Hawaii) to 2.47% (New Jersey). For our $300K home at 1.1%: $275/month.
Homeowner’s insurance: National average in 2026 is $1,784/year ($149/month) according to the Insurance Information Institute. But Florida averages $4,200, Louisiana $3,600, and Oklahoma $3,100. Get actual quotes for your area.
PMI (if less than 20% down): Typically 0.5-1.5% of loan amount annually. On a $270,000 loan (10% down): $113-$338/month until you reach 20% equity.
Maintenance reserve: The general rule is 1-2% of home value annually. For a $300K home: $250-$500/month. New construction leans toward 1%. Older homes (30+ years) should budget 2% or more. This is the number most new homeowners drastically underestimate.
HOA fees (if applicable): National median for condos is $350/month. Single-family HOAs average $100-$250/month. This varies enormously and can increase 5-10% annually.
Total monthly ownership cost for our example: $1,566 (P&I) + $275 (tax) + $149 (insurance) + $375 (maintenance) = $2,365/month
Step 2: Calculate True Monthly Renting Cost
Renting is simpler but not as simple as just the rent check.
Monthly rent: For comparable housing to a $300K home in a typical mid-cost market: approximately $1,600-$1,900/month.
Renter’s insurance: Average $15-$30/month.
Annual rent increases: Budget 3-5% per year. This is the renter’s biggest long-term risk — in 30 years at 3.5% annual increases, your $1,750 rent becomes $4,900/month. Meanwhile, the homeowner’s mortgage payment stays fixed.
Total monthly renting cost (year 1): $1,750 (rent) + $25 (insurance) = $1,775/month
That’s $590/month cheaper than owning in year 1. But that gap shrinks every year as rent increases while the mortgage stays flat.
Step 3: Model the Equity Buildup (The Homeowner’s Advantage)
Turns out the homeowner builds that the renter doesn’t — home equity. But the trajectory might surprise you.
Source: Author’s amortization calculations, appreciation based on Case-Shiller long-term national average of 3.5%.
By year 30, the homeowner has $842,000 in equity (assuming 3.5% appreciation). The mortgage is paid off. Monthly housing cost drops to just taxes, insurance, and maintenance — roughly $800-$1,000/month.
Step 4: Model the Renter’s Investment Portfolio (The Renter’s Advantage)
The renter has two sources of investable money:
The down payment ($60,000): Invested at a 7% average annual return, this grows to $456,000 in 30 years without adding a single dollar.
Monthly savings: In the early years, the renter saves $590/month compared to the owner. This amount shrinks as rent increases. By year 12-15, the costs flip and the owner is actually paying less per month than the renter. The renter stops having monthly savings to invest and starts dipping into their portfolio to cover the rent gap.
Modeling this year by year, the renter’s investment portfolio peaks around year 15-18 at approximately $600,000-$700,000 and then slowly draws down as rent outpaces the owner’s fixed costs. By year 30, the renter’s portfolio is approximately $650,000-$780,000 depending on the exact assumptions.
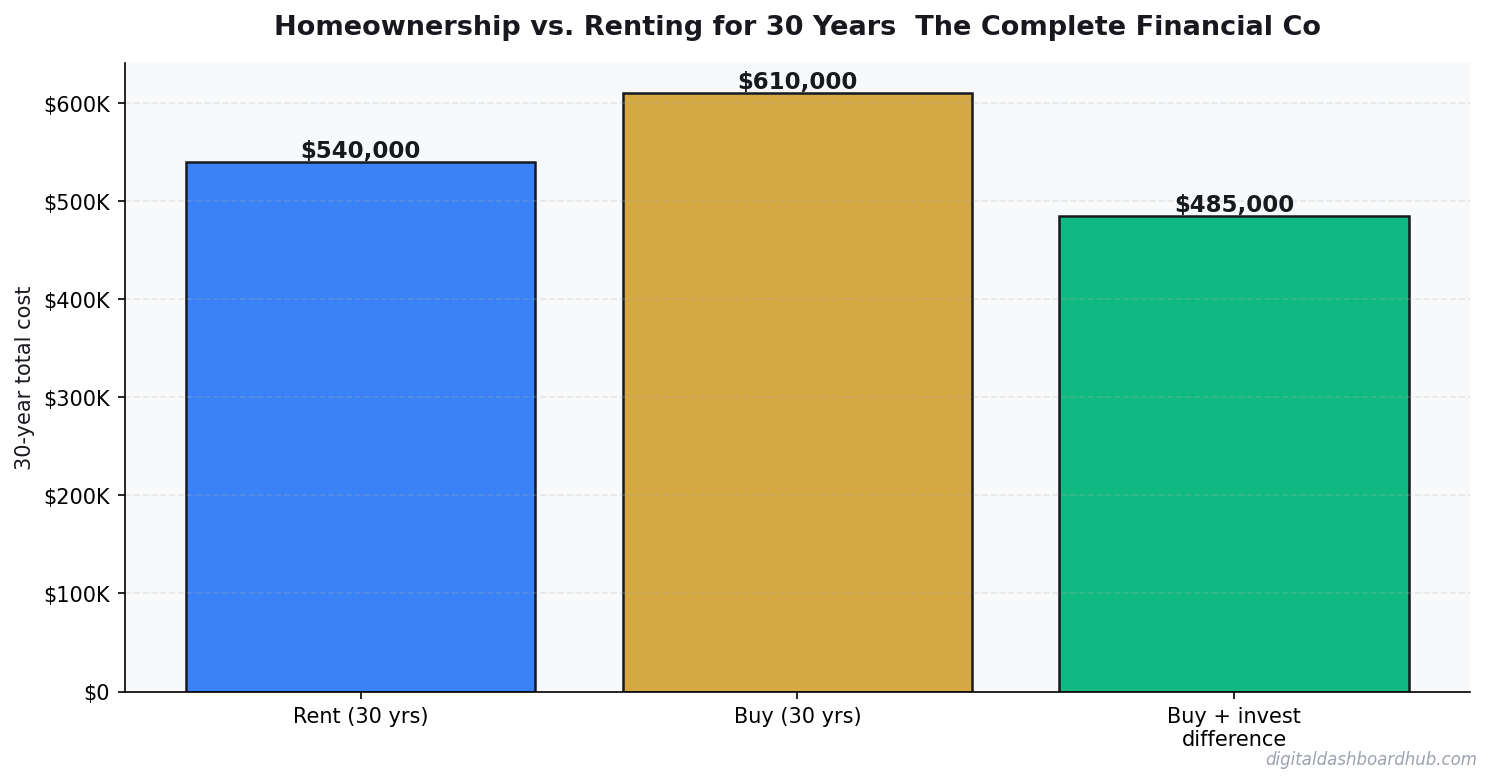
Step 5: Compare Net Worth at Year 30
In this baseline scenario, the homeowner comes out slightly ahead in net worth ($842K vs. $650K-$780K) AND has dramatically lower ongoing costs after year 30. The advantage comes from two things: (1) the home is a forced savings vehicle, and (2) the mortgage payment is inflation-protected while rent is not.
Step 6: Stress-Test Your Assumptions
The comparison above is sensitive to three key variables:
Home appreciation rate: At 3.5%, buying wins. At 2%, it’s roughly a tie. Below 2% average appreciation, renting and investing wins over 30 years.
Investment returns: At 7%, the renter builds a competitive portfolio. At 10% (higher-risk allocation), the renter wins convincingly. At 5% (conservative allocation), the renter falls far behind.
Rent inflation rate: At 3.5%, owning wins in the long run. If rent inflation drops to 2%, renting becomes significantly more competitive because the monthly savings last longer.
Run your comparison with optimistic, moderate, and pessimistic assumptions for each variable. If buying wins in all three scenarios, buy confidently. If renting wins in all three, rent confidently. If it’s mixed — the decision comes down to your personal preferences and risk tolerance.
How the DDH Housing Comparison Tool Handles This
Building this model in a spreadsheet takes 2-3 hours if you know what you’re doing. The DDH Housing Comparison Tool runs the full 30-year model in minutes.
You input your specific numbers — home price, rent, down payment, mortgage rate, property tax rate, expected appreciation, and expected investment returns. The tool generates a year-by-year net worth comparison chart that shows you exactly when (and if) one option overtakes the other.
The sensitivity analysis feature is what makes it special. It runs your comparison under 9 different scenarios (3 appreciation rates x 3 investment return rates) and shows you how the outcome changes. Instead of betting your future on one set of assumptions, you see the full range of possibilities.
Free resource: Sign up for a trial and get the “30-Year Housing Decision Framework” — a PDF worksheet that walks you through every variable step by step.
The Non-Financial Factors That Tip the Scale
In Favor of Owning
- Stability (no surprise moves, no landlord decisions)
- Freedom to modify your living space
- Forced savings discipline (many people won’t invest the difference)
- Emotional value of “home” (real and valid)
- Post-mortgage period: extremely low housing costs
In Favor of Renting
- Mobility (career opportunities, lifestyle changes)
- No maintenance surprises ($15K roof replacement, $8K HVAC failure)
- Lower financial stress (no underwater risk)
- Diversification (your wealth isn’t tied to a single asset in a single market)
- Time (no weekends spent on home maintenance)
The Verdict: It Depends (But Now You Know How to Decide)
In a typical mid-cost market with average appreciation and a 7+ year timeline, buying has a modest financial advantage over 30 years — maybe $50,000-$200,000 in net worth, depending on assumptions. The advantage grows dramatically after year 30 when the mortgage is paid off.
But that advantage assumes you actually maintain the home properly (many people don’t budget for it), you don’t cash-out refinance (extracting equity destroys the math), and the alternative — investing the difference — actually happens (most renters spend it instead).
The honest answer: buying is better for most people over 30 years, primarily because it forces savings. But renting and investing is financially competitive — and sometimes superior — for disciplined investors.
Three Steps to Get Started
- Build your personal model. Use the DDH Housing Comparison Tool with your actual local home prices, rents, and tax rates. Generic advice is worthless for a location-specific decision.
- Run the sensitivity analysis. Test your decision against pessimistic assumptions (low appreciation + high investment returns for renting, or high appreciation + low investment returns for buying). How does it hold up?
- Make the honest self-assessment. If you’re the type to invest the difference religiously in index funds — renting is competitive. If you’d spend it on lifestyle inflation — buying is better because it forces the savings into equity.
Over 15,000 people have used our housing comparison tools to make this decision based on their own numbers. The right answer is personal — but it should be backed by math, not vibes.
Keep reading (related guides):
- True Cost of Your Mortgage Calculator: Its More Than the Payment
- Rental Property ROI Calculator: Is This Deal Actually Worth It?
- Wedding Budget Breakdown: Where Every Dollar Should Go (Free Calculator)
- Best Mortgage Calculator Apps 2026: 7 Tools Tested Head-to-Head
- Never Work Again Calculator: The Exact Number by Age
255+ interactive tools for your money, time, and health.
14-day trial · Stripe checkout · Cancel anytime
Keep Reading
- Rent vs. Buy Calculator 2026
- Mortgage Comparison Calculator: Compare Rates
- Rental Property ROI Calculator
Andy Gaber is the founder of Digital Dashboard Hub, a suite of 255+ interactive financial, productivity, and wellness tools. He built DDH after getting frustrated with financial apps that gave outputs without context. Follow along for tool tutorials, revenue analytics breakdowns, and honest takes on personal finance.