You've launched your Etsy shop. You've optimized your titles, written detailed descriptions, and uploaded high-quality photos. But here's what most sellers don't do: they actually test what's working.
Without A/B testing, you're flying blind. You're guessing about what converts. And guessing costs you money—in lost sales, wasted time, and opportunity cost.
This guide shows you exactly how to run legitimate A/B tests on your Etsy listings, interpret the data correctly, and build a systematic testing workflow that compounds improvements over time.
Why A/B Testing Matters More Than You Think
Etsy is a competitive marketplace. On any given keyword, there are hundreds of shops selling similar products. The difference between a listing that converts and one that doesn't often comes down to small optimizations that successful sellers have tested and refined.
A/B testing is how you find those optimizations without guessing.
Here's the reality: a 10% improvement in conversion rate isn't small. If you have 1,000 monthly visitors and a 2% conversion rate, you're making 20 sales. Improve to a 2.2% conversion rate, and you're at 22 sales. Over a year, that's 24 additional sales. If your average order value is $35, that's $840 in extra revenue from one small test.
And that's just the baseline. Most sellers who systematize testing see 20-30% conversion rate improvements within 6 months.
What to Test on Your Etsy Listings
Not all listing elements have equal testing potential. Some changes move the needle. Others barely matter. Let's focus on the tests that actually impact revenue.
Listing Titles
Your title is the first impression. On Etsy search results, it's the primary text buyers see. It needs to answer two questions: "Is this what I'm looking for?" and "Why should I click this listing instead of the 47 others?"
Test different title structures:
- Title A: "Budget Planner 2024 – Monthly Expense Tracker & Financial Goal Organizer"
- Title B: "Monthly Budget Planner | Expense Tracker | Digital Download"
- Title C: "Printable Budget Planner – Track Expenses & Build Savings Fast"
Title A leads with the specific year and comprehensive benefits. Title B uses pipe separators for clarity. Title C emphasizes the outcome (building savings). One will perform better with your audience. Test to find out which.
Thumbnail Images
Your thumbnail is your hook. Buyers scroll past hundreds of listings. Your image needs to stop the scroll.
Common thumbnail tests:
- Background color variations
- Text overlay presence or absence
- Product photo alone vs. lifestyle/in-use photo
- Color intensity or saturation levels
- Size/scale of the main element
When you change your primary image, you're essentially running a test. Monitor whether clicks increase or decrease.
Pricing
Pricing is one of the most direct revenue tests. A $5 price increase with only a 5% drop in conversion rate is a net win.
Structure your tests strategically:
- Test A: $19.99
- Test B: $24.99
- Test C: $17.99
Don't jump by $10. Move prices in $2-5 increments for cleaner data.
Tags
Tags on Etsy are searchable keywords that help your listing appear in more searches. But the order matters. Etsy gives more weight to tags earlier in your tag list.
Test tag order by rotating which keywords appear in positions 1-3 across different listings in your shop (or A/B test within a single listing if you have enough traffic).
Product Descriptions
Your description is where skeptics become buyers. This is where you handle objections, explain benefits, and build confidence.
Test description approaches:
- Version A: Feature-focused (heavy on specs, materials, dimensions)
- Version B: Benefit-focused (how it solves the buyer's problem)
- Version C: Story-focused (personal journey, why you created it, who it's for)
Measure which approach drives higher favorites-to-views ratios and conversion rates.
How to Run a Proper A/B Test
Running a test sounds simple. It's not. There are hidden variables everywhere. Follow these steps to eliminate them.
Step 1: Change Only One Variable at a Time
This is non-negotiable. If you change your title, thumbnail, and price simultaneously, you won't know which variable drove the result.
Yes, it's slower. Yes, it feels inefficient. But it's the only way to build reliable data.
Step 2: Set Your Testing Duration
The minimum testing period is 7-14 days. Shorter, and you're capturing noise. Seasonal products need 14+ days.
Why this long? Because buyer behavior varies by day of week and hour of day. Some buyers shop on Sunday evening. Others shop during their lunch break on Wednesday. One week captures all these patterns once. Two weeks captures them twice, reducing variance.
Set a calendar reminder. Mark your end date before you start. Don't peek at results early and change course.
Step 3: Consider Sample Size
Small sample sizes are deceptive. If your listing gets 50 views a month, you need 2 months of testing to see whether a change meaningfully moved your conversion rate.
Rough math:
- High-traffic listings (500+ views/month): 1-2 weeks sufficient
- Medium-traffic listings (100-500 views/month): 2-4 weeks
- Low-traffic listings (under 100 views/month): 4+ weeks or run multiple listings in parallel
If your traffic is low, consider running multiple listings with different variations simultaneously. This speeds up learning.
Step 4: Isolate the Variable
For some tests, this is automatic. Changing price is isolated. But for others, you need deliberate discipline.
When testing descriptions, keep titles identical. When testing thumbnails, use the same product photos, same angles, same lighting. When testing tags, keep descriptions and titles unchanged.
The more controlled your test, the more trustworthy your results.
Reading the Data: What Metrics Actually Matter
Etsy gives you raw stats. Most sellers look at the wrong ones.
Views vs. Favorites vs. Conversion Rate
Views are the first funnel stage. More views is good, but it's not the goal. The goal is revenue.
Favorites indicate interest. A listing with 100 views and 8 favorites (8% favorite rate) is outperforming one with 100 views and 3 favorites (3%). But favorites aren't revenue either.
Conversion rate is the metric that matters most. It's the percentage of views that result in purchases.
Calculate it: (Orders / Views) × 100 = Conversion Rate
For established shops, average Etsy conversion rates are 1-3%. If you're at 0.5%, your listings need work. If you're at 3%, you're performing well.
Revenue Per Visit
Here's the nuance most people miss: a price increase that drops conversion rate by 5% but increases revenue per order by 20% is a win.
Calculate: (Total Revenue / Total Views) = Revenue Per Visit
If Test A generates 100 views, 2 sales at $25 each = $50 revenue, $0.50 per visit.
If Test B generates 100 views, 1.8 sales at $35 each = $63 revenue, $0.63 per visit.
Test B is the winner, even though conversion rate dropped.
Time to Track Results
Don't obsess over daily data. Daily swings are noise. Track cumulative data weekly.
Create a simple spreadsheet:
- Date range
- Total views
- Total favorites
- Total orders
- Total revenue
- Conversion rate (%)
- Revenue per visit
Paste these numbers in every Monday and Thursday. You'll see patterns emerge over two weeks.
Common Testing Mistakes That Kill Results
Mistake #1: Changing Too Many Variables
You launched Version 2 with a new title, new thumbnail, new price, and new tags. Sales dropped. Now what?
You don't know what caused the drop. You can't learn. You're stuck.
Change one thing. Test it. Document the result. Move on.
Mistake #2: Not Waiting Long Enough
You changed your title on Monday. By Wednesday, you had 2 fewer sales than the previous Wednesday. "The new title isn't working." You revert.
But Wednesday-to-Wednesday is a 3-day sample. That's not a test. That's a noise reading.
Commit to the testing period. If you committed to 14 days, measure 14 days. Not 10. Not 12. Fourteen.
Mistake #3: Ignoring Seasonality
You tested a Halloween listing in July. By August, it had zero sales. You declared the test a failure.
But seasonal products have seasonal demand. Test year-round products in off-season, and you'll get false negatives.
If you sell seasonal items, either test during their selling season or account for seasonality in your analysis.
Mistake #4: Mistaking Correlation for Causation
Your conversion rate improved. But did it improve because of your title change, or because you posted it right before a major gift-giving holiday?
Run control listings when possible. Keep one listing 100% unchanged while testing a variation of another. The unchanged listing acts as your baseline, showing you what would have happened anyway.
Mistake #5: Stopping Too Early
You're six days into a 14-day test. Early data looks good. "Great! I'll keep this version and move on."
But day 7 could reverse the trend. You're leaving accuracy on the table.
Run the full test. Even if the winner is obvious, complete the full period for confidence.
Building a Systematic Testing Workflow
This is where real gains happen. Most sellers run tests randomly, when they think of it. Successful sellers systematize it.
The Test Calendar
Create a simple calendar for Q2 (April-June). Assign one test per week per listing.
Example:
- Week 1, Listing A: Test title variation
- Week 1, Listing B: Test thumbnail variation
- Week 2, Listing A: Test price point (different variation)
- Week 2, Listing B: Test description structure
Stagger tests so you're always running 2-3 simultaneously. This compounds improvements.
Documentation Template
Create a simple form for every test. Store results in a spreadsheet or shared doc.
Template:
- Test name
- Hypothesis (what I expect to improve)
- Variable tested
- Test start date
- Test end date
- Baseline metrics (previous 2 weeks)
- Test period metrics
- Result (winner/loser/inconclusive)
- Key learning
- Next test to run
You're building a knowledge base. After 12 months of systematic testing, you'll know your audience better than 95% of competing sellers.
Iteration and Compound Results
Here's where it gets exciting. You don't test once and stop. You test, learn, and build on the winner.
If Title Version B outperformed Title Version A, Version B becomes your new control. Next month, you test Title Version C against Title Version B.
The improvements layer. Month 1 yields 5% improvement. Month 2 yields another 5% on top. By month 6, you've compounded to 34% total improvement.
Real-World Testing Examples
Let's look at products in the CSL ecosystem and how testing applies:
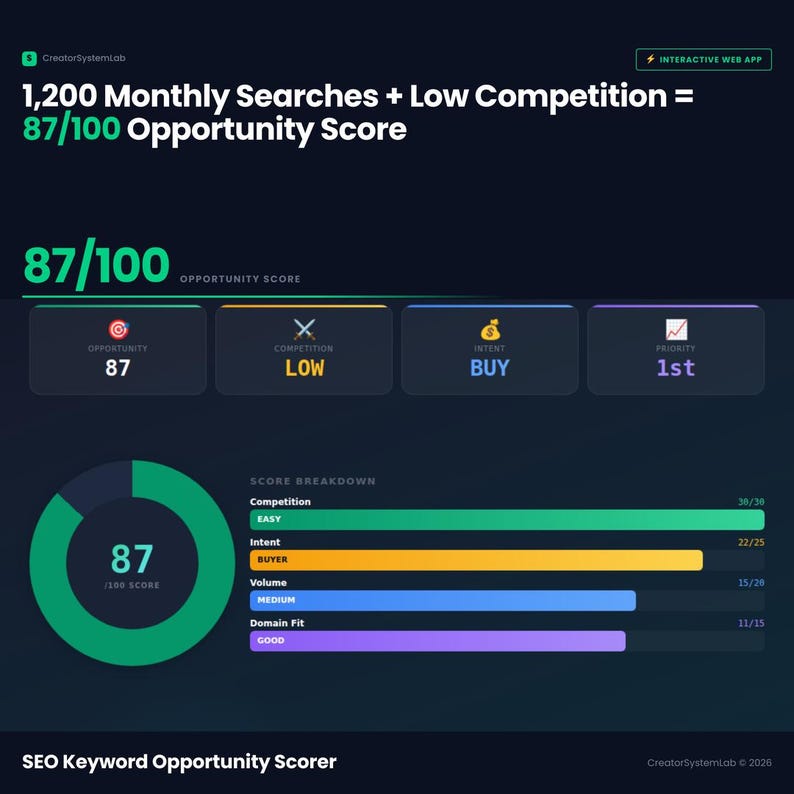
Our Seo Keyword Opportunity Scorer helps sellers find high-opportunity keywords. The product itself answers a specific problem. But the listing could test whether the audience responds better to "SEO Keyword Finder" or "Keyword Opportunity Scorer" in the title.
The Pinterest Analytics Dashboard Google is solution-focused. Testing could involve whether the thumbnail should emphasize the Pinterest logo (trust/recognition) or the dashboard interface (capability).
With the Profit Loss Statement Generator Small, price is a prime testing variable. Small businesses might be price-sensitive. Test whether dropping the price 10% increases conversion rate enough to offset lower margins.
The Creator Passive Income Tracker taps into aspirational language. Test whether the description emphasizes "track your income" or "build passive revenue streams."
The Etsy Listing Command Center Printable and Etsy Systemized Seller Workbook are both management tools. Test whether the audience prefers "command center" framing or "workbook/system" framing.
Each test gives you data. Each piece of data refinesa listing. Refined listings sell better.
Your A/B Testing Action Plan
Don't let this guide sit. Testing compounds only when you implement it.
-
Choose one listing with decent traffic (100+ views/month)
-
Identify one variable to test
-
Create a variation
-
Set your testing calendar (14 days)
-
Document your hypothesis
-
Complete your first test
-
Analyze results
-
Implement the winner (or learn from the loser)
-
Start Test #2
-
Run 8-12 tests
-
Document every result
-
Build your knowledge base
-
Implement compound improvements
Get Strategic Support for Your Testing
You don't have to track all of this manually. We've built tools specifically for Etsy sellers running systematic tests.
Grab our free Etsy A/B Test Tracking Template. It's a pre-built spreadsheet that handles calculations, tracks trends, and shows you which variables are moving your conversion rate.
Insert your data, and it shows you:
- Which tests won
- What your conversion rate trend looks like
- Where to focus next month's tests
- Revenue impact of each improvement
The Bottom Line
A/B testing isn't just a marketing tactic. It's how you compete on Etsy. While other sellers guess, you're gathering evidence. While they chase trends, you're building systematic advantages.
Start small. Test one variable per listing per month. Document the result. Build on the winner. Over 12 months, you'll have a listing suite that outperforms 90% of competition.
And that's worth way more than any traffic hack or Etsy feature launch.
Now go test something.
Download our free Etsy A/B Test Tracking Template and start running confident tests this week. No guessing. No more leaving money on the table.
[Sign up for the template + get our weekly optimization tips]
Ready to take control? Digital Dashboard Hub gives you 255+ interactive tools — budgets, trackers, calculators — all in one place.
Start your free 14-day trial →