I Thought My Car Cost Me $300 a Month. I Was Off by Triple.
The dashboard below loads instantly in your browser. Plug in your numbers, see your answer. No signup to try the basics.
Last January, my wife asked a simple question: “How much does the car actually cost us?” I said $300 a month — payment’s done, insurance is cheap, gas is whatever. She didn’t buy it. So I did what any obsessive spreadsheet person would do: I tracked every single car-related expense for 12 months straight.
The final number was $11,247 for the year. That’s $937 a month. For a 2019 Honda Accord that I own outright. No car payment. I nearly choked on my coffee when I tallied it up in December.
Here’s every dollar, every category, and what I In the end changed because of it.
The Tracking Setup: How I Caught Every Dollar
I created a simple spreadsheet with date, amount, category, and notes. Every time I spent money on anything car-related, it went in. I also set up a separate “hidden costs” section for expenses that don’t feel like car costs but absolutely are.
The categories I tracked: fuel, insurance, maintenance and repairs, registration and fees, depreciation, parking, tolls, car washes, and the opportunity cost of the car’s value sitting in a depreciating asset instead of invested.
That last one is controversial. Some people don’t count it. I do, because if I sold the car, that money could be earning 7-10% annually in the market. Ignoring it is ignoring reality.
The 12-Month Breakdown: Every Category Exposed
Ninety-four cents per mile. AAA’s 2025 estimate for a mid-size sedan was $0.72/mile. I was above that because of urban parking costs and a repair year that included new brakes, tires, and an AC compressor.
The Costs I Never Would Have Guessed
Depreciation was the biggest single cost. My Accord lost roughly $2,800 in value over the year based on KBB comparisons. I owned it free and clear, so there was no monthly payment to remind me money was disappearing. But it was. Every month, the car was worth less, and that’s real money I can never get back.
Parking was the sneakiest. I work downtown three days a week. Garage parking is $15/day. That’s $45/week, $180/month, $2,160/year if I parked every work day. I actually spent $1,320 because I found street parking about 40% of the time. But I was spending 15-20 minutes per trip hunting for spots — time I never accounted for.
Insurance was higher than I thought. I’d been auto-paying $145/month without checking for two years. When I finally shopped around after this exercise, I found the same coverage for $98/month. I’d been overpaying $564/year out of pure laziness.
Month-by-Month: How Costs Fluctuated
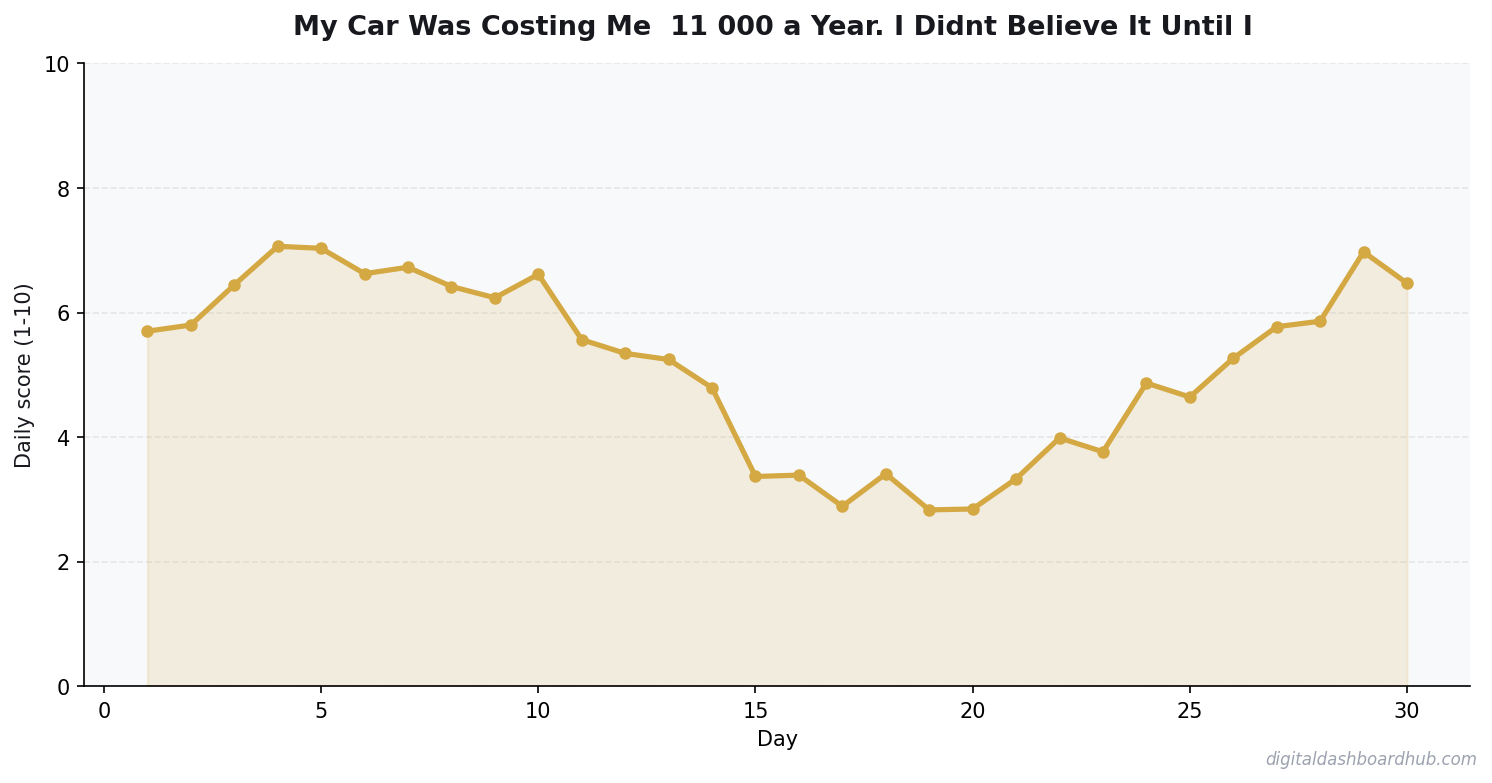
The monthly costs weren’t steady. January hit me with a $487 repair bill (brake pads and rotors). June brought the AC compressor failure — $892. October was registration renewal plus new tires — $1,240 total for the month.
In the “quiet” months with just gas and insurance, I spent around $350. In the expensive months, I was over $1,200. This is why monthly averages are misleading and annual tracking is essential. If I’d only tracked for three quiet months, I would have concluded my car costs $350/month and been wildly wrong.
How the DDH Car Cost Calculator Handles This
After my tracking year, I wished I’d had a tool that could have estimated this upfront. That’s exactly what the DDH Car Cost Per Mile Calculator does.
You plug in your car’s value, annual mileage, fuel efficiency, insurance premium, and estimated maintenance schedule. It calculates your true per-mile cost including depreciation, opportunity cost, and all the hidden categories most people forget. It also compares your cost against public transit, ride-sharing, and e-bike alternatives for your specific commute pattern.
The comparison feature is what makes it actually useful. Knowing your car costs $0.94/mile is interesting. Knowing that Uber for the same trips would cost $0.68/mile is actionable.
The Decision: What I Changed After 12 Months of Data
I didn’t sell the car. But I made four changes that dropped my annual cost by about $3,200:
Switched insurance carriers. Saved $564/year for identical coverage. This took 45 minutes of phone calls. Best hourly rate I’ve ever earned.
Started biking to work two days a week. Cut my parking and fuel costs significantly. Annual savings: roughly $1,100 between parking and gas.
Joined a car wash membership. $20/month unlimited instead of $12-15 per wash every couple weeks. Small savings, but $155 vs $240 is still $85.
Set up a car sinking fund. Instead of getting blindsided by $892 AC repairs, I now set aside $200/month into a dedicated car maintenance fund. This doesn’t reduce the cost, but it eliminates the financial stress. The money’s waiting when something breaks.
The Per-Mile Reality Check That Changes Decisions
Once you know your per-mile cost, everyday decisions look different. A 30-mile round trip to save $15 at a cheaper grocery store? That trip costs $28.20 in car expenses. You’re losing $13.
Driving to a restaurant 20 miles away instead of one 3 miles away? That’s an extra $32 on top of your dinner bill. Suddenly the closer place with slightly higher menu prices is the better deal.
I started mentally adding my per-mile cost to every driving decision. Not obsessively — but enough to catch the trips that were costing more than they were saving. Over a year, this awareness probably saved me another $500-800 in unnecessary driving.
How My Number Compares: National Data
My costs ran higher than AAA’s average because of urban parking and a heavy repair year. In a “normal” maintenance year, I’d probably land around $9,500 — closer to the average. But that’s the point of tracking: averages don’t describe your life. Your specific situation does.
What I’d Tell Someone Before They Buy a Car
Run the real numbers first. Not the monthly payment. Not the sticker price. The total annual cost of ownership including every category in my table above. Then compare it against alternatives.
For some people, the car is essential and worth every penny. For others — especially urban dwellers with good transit — the math says sell it. I landed somewhere in the middle: keep the car, but drive it a lot less and a lot more intentionally.
The tracking changed my behavior more than any budgeting app ever did. There’s something about seeing $11,847 in black and white that makes you actually change.
Do This First
Step 1: Pull your last 12 months of bank and credit card statements. Flag every car-related charge, including ones you wouldn’t normally think of (parking meters, car washes, roadside assistance memberships).
Step 2: Look up your car’s current value on KBB, then check what it was worth 12 months ago. The difference is your depreciation cost — probably your biggest hidden expense.
Step 3: Plug your numbers into the DDH Car Cost Calculator to get your true per-mile cost and see how alternatives compare for your specific commute.
Dig Deeper
- Sinking Fund Savings Goal Planner
- How Sinking Funds Saved Me From Financial Emergencies
- Side Hustle Tax Trap: Track Every Dollar
Keep reading (related guides):
- Business Expense Tracker: Categorize and Export for Tax Time
- How Much Money You Need to Retire Early at 40, 45, and 50 (Real Numbers by Age)
- The Small Business Owners Guide to Expense Tracking (Without Losing Your Mind at Tax Time)
- Freelancer Finance Management Dashboard (VVS): Finally, a Money Tool Built for Variable Income
- Debt Snowball vs Avalanche Calculator: Which Method Saves You More Money
The Car Cost Categories Most People Miss
Everyone tracks the payment, insurance, and gas. That’s maybe 70% of the real cost. The other 30% is where the surprises live — and it’s where my true number went from “about $300 a month” to $917 a month.
Depreciation is your biggest expense
A $35,000 car loses roughly $15,000 in value over the first three years. That’s $5,000 per year of cost even if you never drive it. Most people never count depreciation because it doesn’t show up on a bank statement — but it’s the difference between what you paid and what you can sell it for, and that gap is real money.
Maintenance averages $1,200-$1,800 per year
Oil changes, tires, brakes, alignments, battery replacements, wiper blades, cabin filters. None of these hit monthly, so they feel free — until you add up the year. Set aside $100-$150 per month per car for maintenance and you’ll almost never be surprised.
Registration, inspection, and parking
State fees can run $100-$500 per year. Inspection adds another $50-$150. If you pay for any parking at work, home, or events, that adds up fast. My own hidden category: $640 a year in paid parking I had forgotten about until I searched transactions.
The interest you’re paying on a financed car
If you financed at 7%, the first year of payments on a $25,000 loan is roughly $1,700 in interest alone. That’s not car cost in the “driving” sense — it’s the price of not paying cash. Track it separately so you can see whether financing was actually worth it.
Opportunity cost of the down payment
The $6,000 you put down could have compounded at 7% over ten years to $11,800. That’s a real cost of owning the car. I don’t include this in monthly spending, but I do account for it when deciding whether to replace a car or keep it another year.
Quick FAQ: Hidden Car Costs
How do I actually track car expenses for a full year?
Easiest method: create a “Car” category in your budgeting app or spreadsheet and tag every related transaction as it happens. Harder method: pull 12 months of statements retroactively and grep for gas, auto, insurance, DMV, service center names, etc. Either way, allocate 2-3 hours.
Does a paid-off car actually save me money?
Paying off the loan eliminates $3K-$6K of annual payments, yes. But depreciation, maintenance, and insurance still apply. A paid-off 8-year-old car typically still costs $4K-$6K per year to own. Cheaper than payments, not free.
Should I include my time in car cost calculations?
If you’re making driving decisions (commute vs move closer, errands vs delivery), yes. Value your time at your post-tax hourly rate. A 45-minute round-trip errand isn’t just fuel — it’s often $20-$40 of real time cost.
How does this change for an EV?
Fuel drops 60-75%. Maintenance drops 40% (no oil, fewer brake jobs). Depreciation is less predictable because of faster battery technology cycles. Tires often cost more due to weight. Net: EVs usually save $1K-$2K per year vs comparable gas cars, but the big-ticket items haven’t changed.
What’s the real per-mile cost for a typical driver?
AAA’s 2024 data says 68 cents per mile for the average new car at 15K miles/year. Used cars, older cars, or cheap-to-run models can drop to 35-50 cents. Luxury SUVs and trucks regularly hit 85-110 cents. Your number depends almost entirely on the car you chose to buy.
Key Numbers to Watch Monthly
If you only track five numbers to keep car costs under control, make it these. They cover everything from fuel efficiency to depreciation drift, and each of them can be pulled in under 60 seconds once your system is set up.
1. Miles per gallon actual vs EPA
If you’re beating EPA by 5-10%, your driving habits are efficient. If you’re missing by 15%+, either your driving is aggressive or something mechanical (tires, alignment, fuel injector) is off. A 3 MPG gap on 15,000 annual miles is roughly $450/year at current gas prices.
2. Cost per mile rolling 90-day
Track a rolling 90-day cost-per-mile rather than monthly. Single months get skewed by one-time repairs. A rolling window smooths noise and flags real trends — a climbing number is almost always a sign of deferred maintenance catching up.
3. Insurance rate per $1,000 of coverage
Most people see premium totals but miss rate changes on the underlying coverage. If premiums rise 8% but you added a driver, that’s normal. If premiums rise 18% with no changes, shop carriers — loyalty rarely pays in auto insurance.
4. Maintenance spend vs car value
When annual maintenance + repairs exceeds 50% of the car’s trade-in value, the economics of keeping the car flip. It’s not always the right time to sell, but the calculation deserves a hard look.
5. Depreciation curve checkpoints
Check trade-in and private-party values every 6 months. A normal car loses 10-15% of its value per year for years 2-5, then 5-8% per year after. Dramatic deviations (either direction) tell you something about the market or your specific model.
255+ interactive tools for your money, time, and health.
Full dashboard access · Stripe-secure checkout · Cancel anytime
Andy Gaber is the founder of Digital Dashboard Hub, a suite of 255+ interactive financial, productivity, and wellness tools. He built DDH after getting frustrated with financial apps that gave outputs without context. Follow along for tool tutorials, revenue analytics breakdowns, and honest takes on personal finance.