
You Listed 50 Products and Made $47 Last Month. Now What?
Enter your own numbers in the interactive tool below and get a real-time read. The dashboard version adds saved scenarios, history, and full feature access.
Etsy sellers throw products at the wall and hope something sticks. That’s not a strategy — it’s a lottery ticket with listing fees. The math on Etsy revenue is straightforward once you understand the formula, and it tells you exactly which levers to pull: more listings, more traffic, better conversion, or higher prices. Most sellers are pulling the wrong one.
The Etsy Revenue Formula
Monthly Revenue = Active Listings × Views Per Listing × Conversion Rate × Average Order Value
Then subtract fees. Let’s break down each variable with real benchmarks.
Views Per Listing
This depends entirely on your niche, SEO quality, and listing age. Here are realistic ranges from actual Etsy seller data:
Conversion Rate
Etsy’s platform average conversion rate is 1-3%. Top sellers hit 3-5%. If you’re below 1%, your listing has a problem — usually photos, pricing, or reviews.
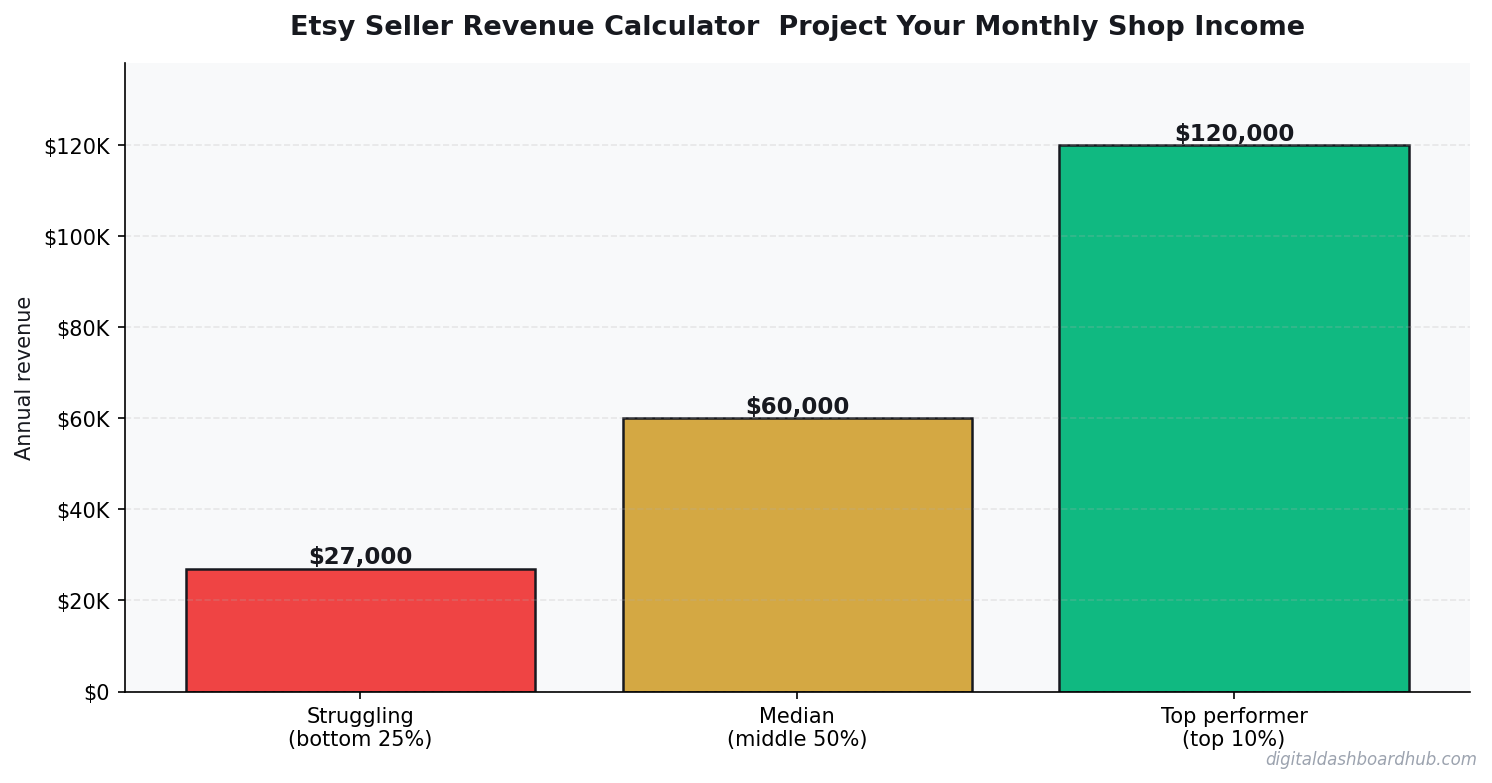
Revenue Projections by Shop Size
Let’s model three scenarios with realistic numbers:
Etsy’s Fee Structure: Every Dollar They Take
Etsy’s fees are more complex than most sellers realize:
- Listing fee: $0.20 per listing (renews every 4 months or upon sale)
- Transaction fee: 6.5% of total sale price (including shipping charged to buyer)
- Payment processing: 3% + $0.25 per transaction
- Offsite ads fee: 15% on sales from Etsy’s offsite ads (12% if you do $10K+/year). You can opt out if you make under $10K/year.
- Etsy Ads (optional): CPC varies, typically $0.20-$0.80 per click
- Currency conversion: 2.5% if selling internationally
Total fee burden: 10-15% on organic sales, 25-30% on offsite ad-driven sales.
On a $30 product with free shipping (where you bake $5 shipping into price), Etsy takes approximately $3.55 in fees on an organic sale. Your actual revenue per unit is $26.45 before cost of goods.
The Listing Volume Game
On Etsy, more listings = more surface area in search. The data is clear:
- Shops with under 50 listings average $200-$800/month
- Shops with 100-200 listings average $1,000-$5,000/month
- Shops with 300+ listings average $3,000-$15,000/month
This doesn’t mean listing junk. Each listing needs strong photos, optimized titles (front-load keywords), and all 13 tags used. But volume matters because Etsy’s algorithm favors shops that actively add inventory.
Revenue Optimization Cheat Sheet
I built a one-page Etsy revenue optimization checklist that covers the 8 highest-impact changes sellers can make — from photo improvements (which boost conversion 30-50%) to pricing strategy (most sellers undercharge by 20-30%). Available inside Digital Dashboard Hub when you sign up for a free trial.
Which Lever Should You Pull?
If you want to double your Etsy revenue, here are your options ranked by effort-to-impact:
- Double your conversion rate (better photos + descriptions) — highest impact, lowest cost. Going from 1.5% to 3% doubles revenue with zero additional traffic.
- Raise prices 20-30% — if your conversion rate is above 3%, you have pricing power. A 25% price increase with a 10% conversion drop still nets you more revenue.
- Add 50-100 new listings — more surface area in search. But only if each listing meets quality standards.
- Run Etsy Ads — can accelerate growth but eats 15-30% of revenue on ad-driven sales. Only profitable if your margins support it.
- Diversify off Etsy — Shopify, Amazon Handmade, or your own site. Eliminates the 6.5% transaction fee and gives you customer data Etsy keeps from you.
Seasonal Revenue Patterns
Etsy traffic follows predictable patterns. Plan your inventory and listing schedule around them:
- January-February: -20 to -30% (post-holiday hangover)
- March-April: Baseline (spring shopping picks up)
- May-June: +10-20% (wedding season, Mother’s Day, Father’s Day, graduation)
- July-August: -10 to -15% (summer slowdown)
- September-October: +15-25% (fall decor, holiday shopping starts early)
- November-December: +40-80% (Q4 is everything on Etsy — some sellers make 40% of annual revenue in these 8 weeks)
Your Next Move
- Pull your actual numbers from Etsy Stats. Total views, conversion rate, and average order value for the last 90 days. These are your baseline — not industry averages.
- Identify your weakest metric. Low views? Your SEO needs work. Low conversion? Fix photos and pricing. Low average order? Bundle products or raise prices.
- Set a 90-day target for improving that single metric by 30-50%. Model what that improvement does to your monthly revenue. One lever at a time.
Over 500 business owners use Digital Dashboard Hub’s revenue calculators to model projections with real data. Start your free trial and project your Etsy shop revenue in under 5 minutes.
Real Etsy Shop Revenue: What the Numbers Actually Look Like
Let’s run a concrete scenario for a digital download shop — the highest-margin Etsy model. Sarah sells SVG cut files and Canva templates. Average price: $4.50. Monthly sales: 280 transactions. Gross revenue: $1,260/month.
Etsy fees breakdown: listing fees ($0.20 × 280 renewals = $56), transaction fees (6.5% × $1,260 = $81.90), payment processing (3% + $0.25 × 280 = $107.80), Etsy Ads budget ($120). Total fees: ~$365.70/month. Net before taxes: $894.30/month on $1,260 gross — a 29% fee bite.
That’s before accounting for time. If she spends 15 hours/month creating new files and answering messages, her effective hourly rate is $59.60. Not bad — but also not the “passive income” most Etsy digital product creators talk about. The first 6 months of building inventory are definitely not passive.
The Ceiling Problem With Etsy
Etsy controls your customer relationship. You can’t email your buyers directly, can’t run your own retargeting ads to them, and can’t move them to a lower-fee platform without violating Etsy’s terms. When Etsy changes its algorithm or raises fees (as it has several times), your revenue changes with no recourse.
The shops that build real equity use Etsy as acquisition but drive buyers to their own email list through packaging inserts for physical goods or PDF download pages for digital goods. An email list of 2,000 past buyers is worth 5x a similar-sized Etsy shop because you own the customer relationship. That’s the exit strategy from Etsy dependency — not leaving, but adding an owned channel alongside it.
The platform diversification move that matters most for Etsy sellers: your own Shopify or Squarespace store, running in parallel. You can list the same digital products on both. Etsy drives discovery; your own store has zero transaction fees beyond payment processing. Over 12 months, sellers who redirect 20–30% of repeat buyers to their own store often see that channel surpass Etsy revenue — with significantly better margins. Start it early, before you need it, so the domain authority has time to build.
Keep reading (related guides):
- How Much Do Etsy Sellers Really Make? 2026 Revenue Data
- How Much Do Etsy Sellers Really Make in 2026? I Analyzed 200 Shops
- Etsy Fees Explained: What Youre Actually Paying and How to Calculate Your Real Profit
- Etsy Revenue Tracker: How to Know Which Products Are Actually Worth Your Time
- Barber Shop Revenue Calculator
255+ interactive tools for your money, time, and health.
Full features for 14 days · Secure payment · Stop anytime
Keep Reading
- The Side Hustle Tax Trap: Track Every Dollar
- Side Hustle Income & Tax Tracker
- Freelancer Finance Dashboard
Common Questions About Etsy Seller Revenue Calculator: Project Your Monthly Shop Income
How long does it take to see results?
Most people see meaningful progress within 30-90 days when they apply these strategies consistently. The key is tracking your numbers from day one so you have a baseline to measure against.
What’s the biggest mistake people make?
Trying to do everything at once. Pick one or two strategies from this guide, implement them fully, then layer in additional tactics. Spreading yourself thin is the fastest way to see no results from any of it.
Do I need special tools or software?
Not necessarily to start — but the right tools eliminate hours of manual work. Our free calculators and trackers at Digital Dashboard Hub are a good starting point before you invest in paid software.
Andy Gaber is the founder of Digital Dashboard Hub, a suite of 255+ interactive financial, productivity, and wellness tools. He built DDH after getting frustrated with financial apps that gave outputs without context. Follow along for tool tutorials, revenue analytics breakdowns, and honest takes on personal finance.