Use the free Bookkeeper Revenue Calculator below — plug in your real numbers and get instant results. No signup required for the lite version.
Try the Bookkeeper Revenue Calculator
Jump in: the tool below is live and free to play with. Upgrade to a dashboard account when you want to save scenarios and track over time.
Bookkeeper Revenue Calculator
Enter your numbers below — results update instantly
Want the full Bookkeeper dashboard with expense tracking, break-even analysis, and growth projections?
Why This Matters
Running numbers in your head is how bad financial decisions happen. A quick calculation with real data beats a gut feeling every single time. I built this tool because I was tired of spreadsheet gymnastics just to answer basic questions about my finances.
The calculator above handles the basics. But if you need trend tracking, scenario comparison, and exportable reports — the full version inside Digital Dashboard Hub does all of that and more.
What You Get in the Full Dashboard
| Approach | Startup Cost | Time Investment | Revenue Potential | Best For |
|---|---|---|---|---|
| Solo operator | Low ($1K-$10K) | Full time | $60K-$200K/yr | Maximum margins, full control |
| Small team (2-5) | Medium ($10K-$50K) | Management + some fieldwork | $200K-$800K/yr | Scaling without losing control |
| DDH Revenue Tracker | Free trial | 5 min setup | N/A (profit tool) | Know your real numbers in real time |
The full Bookkeeper Revenue Calculator inside DDH includes features the lite version above can’t offer:
- Historical tracking — see your numbers change over weeks and months
- Visual charts — bar graphs, trend lines, and breakdowns that make patterns obvious
- Scenario modeling — “what if I change X?” comparisons side by side
- PDF reports — export professional reports for partners, lenders, or your own records
- — one subscription covers every calculator and tracker in the library
How to Use This Tool
Step 1: Enter your actual numbers in the fields above. Don’t guess — pull from your bank statements or business records for the most accurate results.
Step 2: Read the output cards. They update instantly as you type. Play with different scenarios to see how small changes affect your bottom line.
Step 3: If you want to save your results, track changes over time, or run more advanced projections — start a free 14-day trial of the full dashboard. No credit card required.
Your Next Move
You’ve already done the hardest part — you looked at your numbers instead of avoiding them. Here’s what to do with that momentum:
- Right now (30 seconds): Bookmark this page so you can rerun the calculation next month
- This week: Pull your real numbers from your accounts and run them through the calculator above
- Long game: Try the full DDH dashboard — 261 tools, 14 days free, cancel anytime
Read On
- Rental Property ROI Calculator: Is This Deal Actually Worth It?
- How to Calculate Your Net Worth (And Why It’s the Only Financial Number That Matters)
- Micro-Business Operations Dashboard: The All-in-One Command Center for Businesses Under 10 Employees
Common Questions About Bookkeeper Revenue Calculator
How long does it take to see results?
Most people see meaningful progress within 30-90 days when they apply these strategies consistently. The key is tracking your numbers from day one so you have a baseline to measure against.
What’s the biggest mistake people make?
Trying to do everything at once. Pick one or two strategies from this guide, implement them fully, then layer in additional tactics. Spreading yourself thin is the fastest way to see no results from any of it.
Do I need special tools or software?
Not necessarily to start — but the right tools eliminate hours of manual work. Our free calculators and trackers at Digital Dashboard Hub are a good starting point before you invest in paid software.
What a Bookkeeping Practice Actually Nets — Real Numbers
A solo bookkeeper with 12 monthly clients, 3 years in, working 25 hours/week.
Monthly client mix: 4 clients at $400/month, 5 at $650/month, 3 at $950/month. Monthly recurring revenue: $7,700. Annual: $92,400. Plus quarterly cleanup projects and tax season add-ons: ~$8,000/year. Total gross: ~$100,400.
Expenses: Software (QuickBooks ProAdvisor, Gusto, practice management): $380/month. E&O insurance: $100/month. Professional development: $80/month avg. Total expenses: ~$6,720/year. Net income: ~$93,680 — working 25 hours/week, fully remote.
The 3 Factors That Move Bookkeeper Revenue Most
1. Niche specialization. A bookkeeper who works exclusively with restaurant groups or e-commerce sellers charges 40-60% more than a generalist and lands clients faster. “I do bookkeeping for Shopify sellers” gets more referrals than “I do bookkeeping for small businesses.”
2. Service packaging. Flat-rate monthly retainers based on transaction volume outperform hourly billing. Every hour you save through efficiency is pure margin gain. Hourly billing actively punishes your own improvement.
3. Client quality over client count. 8 well-organized clients at $800/month is more profitable and less stressful than 20 chaotic clients at $350/month. Most bookkeepers raise rates 10% when they should raise them 40%.
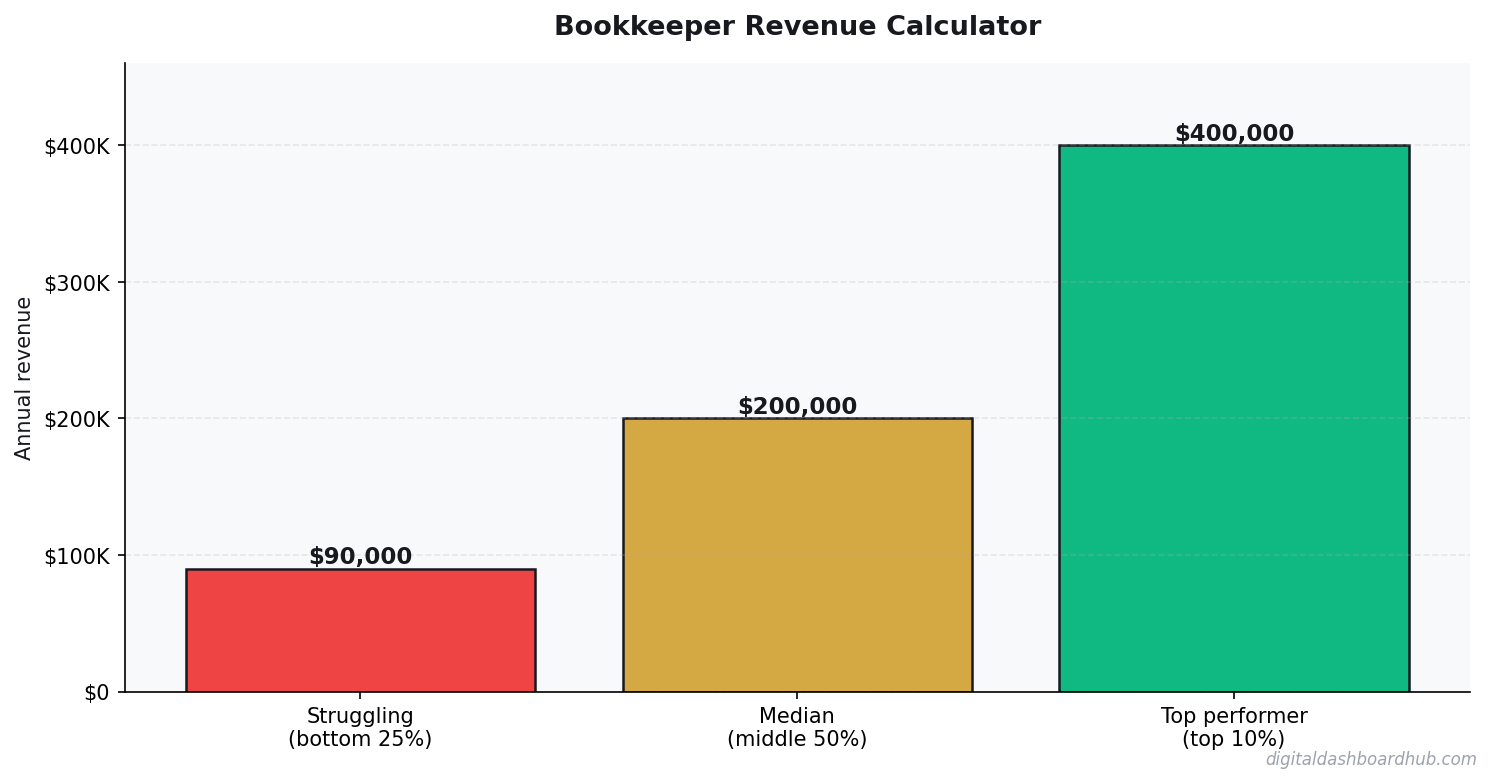
What Bookkeepers Actually Earn vs. What the Market Says They Do
The national median for bookkeeping is often cited around $45,000–$55,000/year for employees. But freelance and firm-owner bookkeepers work in a completely different income bracket. A solo bookkeeper managing 15–20 small business clients at $350–$800/month each can clear $70,000–$180,000/year working 30–40 hours per week. The ceiling on the employee track is $75,000–$90,000 in most markets. The ceiling on the practice-owner track is wherever you want to build it.
Specialization is the fastest way to raise rates without adding clients. A bookkeeper who becomes the go-to person for restaurant accounting, e-commerce businesses, or medical practices can charge 40–60% more than a generalist. The specialization signals expertise, reduces onboarding friction, and leads to referrals within that industry network.
Advisory services are where the real income growth is happening. Bookkeepers who offer cash flow forecasting, KPI dashboards, and monthly CFO-style calls are billing $1,500–$3,500/month per client versus $350–$600 for basic categorization and reconciliation. The work isn’t dramatically harder — it’s packaged and positioned differently.
The True Cost of Running a Bookkeeping Practice
The overhead on a solo bookkeeping practice is genuinely low, which is what makes the margins exceptional. QuickBooks or Xero certification ($300–$600/year), practice management software ($100–$300/month), professional liability insurance ($500–$1,500/year), and a reliable computer. All-in overhead rarely exceeds $8,000–$12,000/year for a solo operator.
Client acquisition is the only real cost. CPAs are the best referral source — they hate bookkeeping, they have clients who need it, and a warm referral from a CPA converts immediately. Building relationships with 3–5 active CPA referral partners is worth more than any paid advertising a bookkeeping practice will ever run. Time investment: 5–10 hours over 60 days. Return: often $30,000–$80,000 in annual recurring revenue within 12 months.
Churn is the hidden killer. Losing 1 client per quarter at $500/month means replacing $2,000/month just to stay flat. The bookkeepers who grow fastest are obsessive about client retention: proactive communication, catching issues before clients do, and quarterly business reviews that remind clients the value is real. High-touch service in bookkeeping has extremely low churn — some practices run under 5% annually.
SaaS Metrics That Predict Revenue 90 Days Out
Most SaaS founders track lagging indicators — revenue, churn, MRR growth — and react after the damage is done. These three leading indicators give you a 60–90 day warning window:
Trial activation rate. The percentage of trials that complete your core onboarding action (not just sign up — actually use the product) predicts paid conversion rate almost perfectly. If activation drops 5 points, expect paid conversions to drop 2–3 points 30 days later. Fix activation before you spend more on acquisition.
Feature adoption breadth. Customers using 3+ features churn at roughly half the rate of customers using 1 feature. If new signups aren’t adopting secondary features within the first 14 days, your onboarding is creating single-feature customers who are one bad experience away from canceling.
Support ticket volume per customer. A rising ticket rate signals product confusion, which precedes churn by 4–6 weeks. Track it per cohort — if a specific month’s cohort is generating more tickets, something in that period’s onboarding or feature release broke the experience.
Keep reading (related guides):
Instant signup · Stripe-secure · Cancel in one click
Andy Gaber is the founder of Digital Dashboard Hub, a suite of 255+ interactive financial, productivity, and wellness tools. He built DDH after getting frustrated with financial apps that gave outputs without context. Follow along for tool tutorials, revenue analytics breakdowns, and honest takes on personal finance.