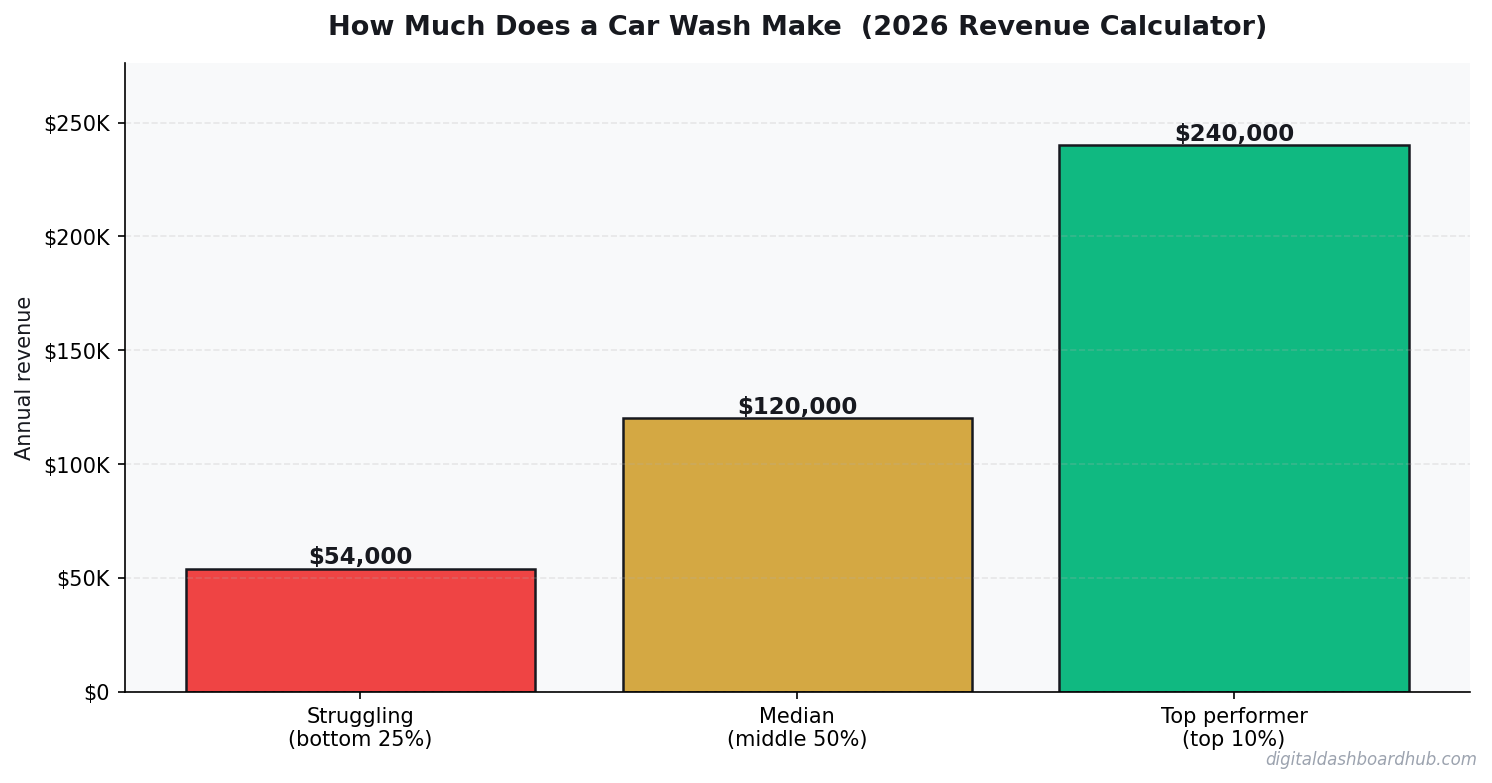
If you’ve ever Googled “how much does a car wash make?” you already know the answers are all over the place. Some sites say $50K. Others say $500K. The real answer depends entirely on your numbers — and that’s exactly what the free calculator below figures out.
Use the Free Car Wash Tool
Enter your own numbers in the interactive tool below and get a real-time read. The dashboard version adds saved scenarios, history, and full feature access.
I built Digital Dashboard Hub after spending years looking for tools that actually worked without a spreadsheet degree. Here’s what I’ve learned:
What Car Wash Owners Actually Take Home
An automated tunnel wash doing 100-200 cars/day grosses $40K-$70K/month. Chemical/water costs (8-12%), equipment maintenance (5-8%), labor (15-25%), and debt service leave net margins at 35-50% for established locations.
Monthly membership plans at $20-$40/month convert 15-25% of customers into recurring revenue. That predictable base covers your fixed costs.
What the Numbers Don’t Tell You (Until Now)
| Approach | Startup Cost | Time Investment | Revenue Potential | Best For |
|---|---|---|---|---|
| Solo operator | Low ($1K-$10K) | Full time | $60K-$200K/yr | Maximum margins, full control |
| Small team (2-5) | Medium ($10K-$50K) | Management + some fieldwork | $200K-$800K/yr | Scaling without losing control |
| DDH Revenue Tracker | Free trial | 5 min setup | N/A (profit tool) | Know your real numbers in real time |
The biggest line item? Equipment maintenance and water/chemical costs run $3k-$8k/month — but the real capital expense is the build-out ($500k-$3m) you’re servicing debt on.
Converting 50 single-wash customers to monthly unlimited adds $1,500-$2,000/month in guaranteed recurring revenue. Members wash 4-6x/month costing $2-$3/wash but paying $30-$40/month.
The Mistake That Costs Thousands
Skimping on the dryer. The #1 complaint is water spots. A $15K dryer upgrade pays for itself in 6 months.
Spring pollen season and winter salt season are peak. Rain kills same-day volume by 40-60% — another reason to push memberships.
What the Full Dashboard Looks Like
How to Use This Calculator
Start by entering your actual numbers — not estimates. Pull from your bank statements, your POS system, or your accounting software. The difference between estimated and real inputs is usually the difference between “this looks fine” and “oh, that’s where the money is going.”
Then change one variable at a time. For car wash, the lever that usually moves the needle most is converting 50 single-wash customers to monthly unlimited adds $1,500-$2,000/month in guaranteed recurring revenue. Start there.
If you want to save these projections, track them month-over-month, or model different scenarios side by side, the full dashboard does all of that. Free 14-day trial, no credit card required.
Your Next Move
Related Tools and Articles
- How Much Money You Need to Retire Early at 40, 45, and 50 (Real Numbers by Age)
- Sinking Fund & Savings Goal Planner: The Free Visual Dashboard That Kills Surprise Expenses
- The Small Business Owner’s Guide to Expense Tracking (Without Losing Your Mind at Tax Time)
Common Questions About How Much Does a Car Wash Make? (2026 Revenue Calculator)
How long does it take to see results?
Most people see meaningful progress within 30-90 days when they apply these strategies consistently. The key is tracking your numbers from day one so you have a baseline to measure against.
What’s the biggest mistake people make?
Trying to do everything at once. Pick one or two strategies from this guide, implement them fully, then layer in additional tactics. Spreading yourself thin is the fastest way to see no results from any of it.
Do I need special tools or software?
Not necessarily to start — but the right tools eliminate hours of manual work. Our free calculators and trackers at Digital Dashboard Hub are a good starting point before you invest in paid software.
What a Real Car Wash Actually Earns: A Worked Example
Take a self-service + express tunnel combo wash in suburban Dallas. 6 bays open 7 days a week, averaging 90 car washes per day between tunnel and self-serve. Average ticket: $14. That’s $1,260/day in gross revenue — or $460,440/year before a single expense.
Strip out labor ($85K), utilities ($40K), supplies ($22K), equipment maintenance ($30K), rent or debt service ($96K), and insurance ($12K), and you’re left with roughly $175K net. Not life-changing for the capital required, but solid — and it compounds fast when you add a monthly membership program.
The operators making $300K+ are running memberships, not per-wash pricing. A car wash with 400 monthly members at $29/month generates $139K in predictable annual revenue before a single walk-in customer.
The 3 Levers That Move Car Wash Revenue Most
1. Location and traffic count. This is everything. A car wash on a road doing 25,000 vehicles/day will out-earn the same exact setup on a road doing 8,000/day — same price, same hours. If you’re evaluating a location, get the AADT (Annual Average Daily Traffic) from your state DOT before anything else.
2. Monthly membership penetration. The top operators target 15-20% of monthly volume as members. It flattens out the weather revenue swings (rain kills single-wash customers; members wash regardless) and creates recurring revenue that your P&L can actually plan around.
3. Hours and throughput efficiency. A tunnel wash making one car per 45 seconds vs. one per 90 seconds is running at half the capacity. The mechanical maintenance decisions — keeping conveyors tight, replacing worn brushes on schedule — directly translate to revenue per operating hour. This is where inexperienced owners leave the most money on the table.
What Most People Get Wrong When Estimating Car Wash Revenue
They use national averages and apply them to their specific market without adjustment. The IBWA publishes average revenue figures, but those averages include a wide range of formats (full-service vs. express tunnel vs. self-serve) and markets (Manhattan vs. rural Iowa) that have almost nothing in common.
The other big mistake: underestimating seasonal variance. In cold-weather markets, car wash revenue can drop 40-60% in the worst winter months. If your financial model assumes consistent year-round volume, your first February will be a rude awakening. Plan for it explicitly — that’s what the calculator above is built to help you do.
The Biggest Revenue Mistakes New Car Wash Owners Make
They launch without a membership program. Single-wash pricing is fine as the entry point, but the operators who build real wealth in car washing do it on recurring monthly revenue. A customer paying $29/month washes their car 4-6 times more often than one paying per wash — and the operator captures all of that without any incremental marketing spend.
The second mistake: ignoring the express exterior segment because it feels “downmarket.” Express exterior — fast conveyor tunnels, no interior service, $8-$15 price point — has the highest throughput per hour of any car wash format. The throughput economics are simply better than full-service at half the ticket.
Third mistake: underbudgeting for equipment maintenance. A conveyor tunnel doing 200+ cars per day will need serious maintenance: monthly brush replacements, quarterly conveyor inspections, annual motor overhauls. Operators who budget 5-7% of revenue for maintenance run more uptime than operators who wait for things to break.
Using the Revenue Calculator for Real Decisions
The calculator above isn’t just a curiosity tool — it’s most useful when you vary the inputs to answer specific questions. What happens to annual net if I add 30 monthly members? What’s the breakeven on a second conveyor lane? How much does a $3 ticket price increase affect annual profit vs. how much volume I’d need to make up if I raise prices and lose customers?
Run these scenarios before you make decisions, not after. The math is fast and the cost of a bad operating decision is not. A $15,000 equipment upgrade that increases throughput by 20% during peak hours might pay back in 8 months — or 3 years, depending on your specific volume and pricing. The calculator tells you which one it is for your numbers.
Keep reading (related guides):
- Auto Mechanic Revenue: What Owners Make vs. What Youd Expect (2026)
- Boutique Revenue Calculator
- Micro-Business Operations in 2026: Enterprise Tools vs. DIY Stacks vs. All-in-One Platforms Compared
- How Much Does a Cleaning Business Make? (2026 Revenue Calculator)
- A/B Testing Your Etsy Listings: How to Know Whats Actually Working
255+ interactive tools for your money, time, and health.
Full features for 14 days · Secure payment · Stop anytime
What Most People Get Wrong
The single biggest mistake is treating revenue as the headline number. Revenue is vanity — margin is sanity, and cash-in-bank is reality. Two operators with identical top-lines routinely end the year $80K apart in take-home, because one priced for volume and the other priced for sustainability. The calculator above forces you to surface that gap before it hits your bank account.
The second mistake is modeling a “best case” and planning around it. The number you should plan around is the 30th-percentile scenario — enough demand to matter, but slower than you hoped. If the business still covers your living expenses there, you have real margin of safety. If it only works in the 80th-percentile case, you are building on sand.
The third mistake is ignoring your time as a cost. If you would otherwise earn $55/hr at a day job and this operation pays you effectively $18/hr for 60-hour weeks, the gap is the real price of running it. Plug your opportunity cost into the calculator and the picture often flips.
How to Pressure-Test Your Numbers
Start with the calculator, then stress-test three levers independently:
- Pricing: What happens to your take-home if you raise prices 10%, but lose 15% of volume? Most operators are surprised to find net income goes up.
- Costs: What happens if your largest input cost rises 20%? This is not hypothetical — it is a typical 12-month swing in most industries.
- Volume: What happens at 70% of your planned volume for 90 days? If that still covers fixed costs, you have a real business. If not, the model is fragile.
Running the calculator three ways takes about ten minutes. The clarity on the other side of those ten minutes is usually the difference between a confident operating plan and guessing for another six months.
Frequently Asked Questions
How accurate is this calculator?
The underlying math uses industry-standard margin and cost ranges sourced from the How Much Does a Car Wash Make? space. Your actual numbers depend on location, seasonality, and operating style, so treat this as a directional benchmark, not a guarantee. The more precisely you enter your inputs, the tighter the output range becomes.
Can I save my results?
A free Digital Dashboard Hub account saves every scenario you run, lets you compare side-by-side, and unlocks the full dashboard with expense tracking and month-over-month charts. The 14-day trial includes the complete tool library — no credit card required to start.
Who is this tool for?
It’s built for anyone pressure-testing a real decision — existing operators auditing their margins, side-hustlers deciding whether to go full-time, and prospective owners trying to sanity-check a business plan before signing a lease. You do not need any accounting background to use it.
What should I do with the results?
Start by comparing the output against your current (or projected) monthly take-home. If the gap is big, walk back the inputs and identify which lever — pricing, volume, or cost structure — is doing the damage. That is usually where the highest-leverage fix lives.
The Bottom Line
Most operators lose money not because the math is impossible, but because they never actually ran it. Fifteen minutes with the calculator beats three months of guessing. Run your numbers, screenshot the output, and use it as the baseline for every pricing and cost decision over the next quarter.
When you are ready to go deeper, the full Digital Dashboard Hub workspace lets you save scenarios, track actuals month-over-month, and see the trend before problems compound. That is the version that actually compounds the effort — spreadsheets forgotten in a Google Drive folder do not.
Next Steps
- Run the calculator above with your best current estimates.
- Re-run it with a pessimistic scenario (lower volume, higher costs) and a stretch scenario (better pricing, more efficient ops).
- Screenshot all three outputs so you have a baseline to compare against when reality arrives.
- Revisit monthly — the number that matters is the one that changes with your real P&L.
Ready for the full dashboard?
Unlock all 255 tools across business, creator, and health workflows.
Andy Gaber is the founder of Digital Dashboard Hub, a suite of 255+ interactive financial, productivity, and wellness tools. He built DDH after getting frustrated with financial apps that gave outputs without context. Follow along for tool tutorials, revenue analytics breakdowns, and honest takes on personal finance.