
Month 0: $487 in Equipment, Zero Clients, and a Craigslist Ad
After testing dozens of approaches with DDH users, I’ve found what consistently works. Let me share the real picture:
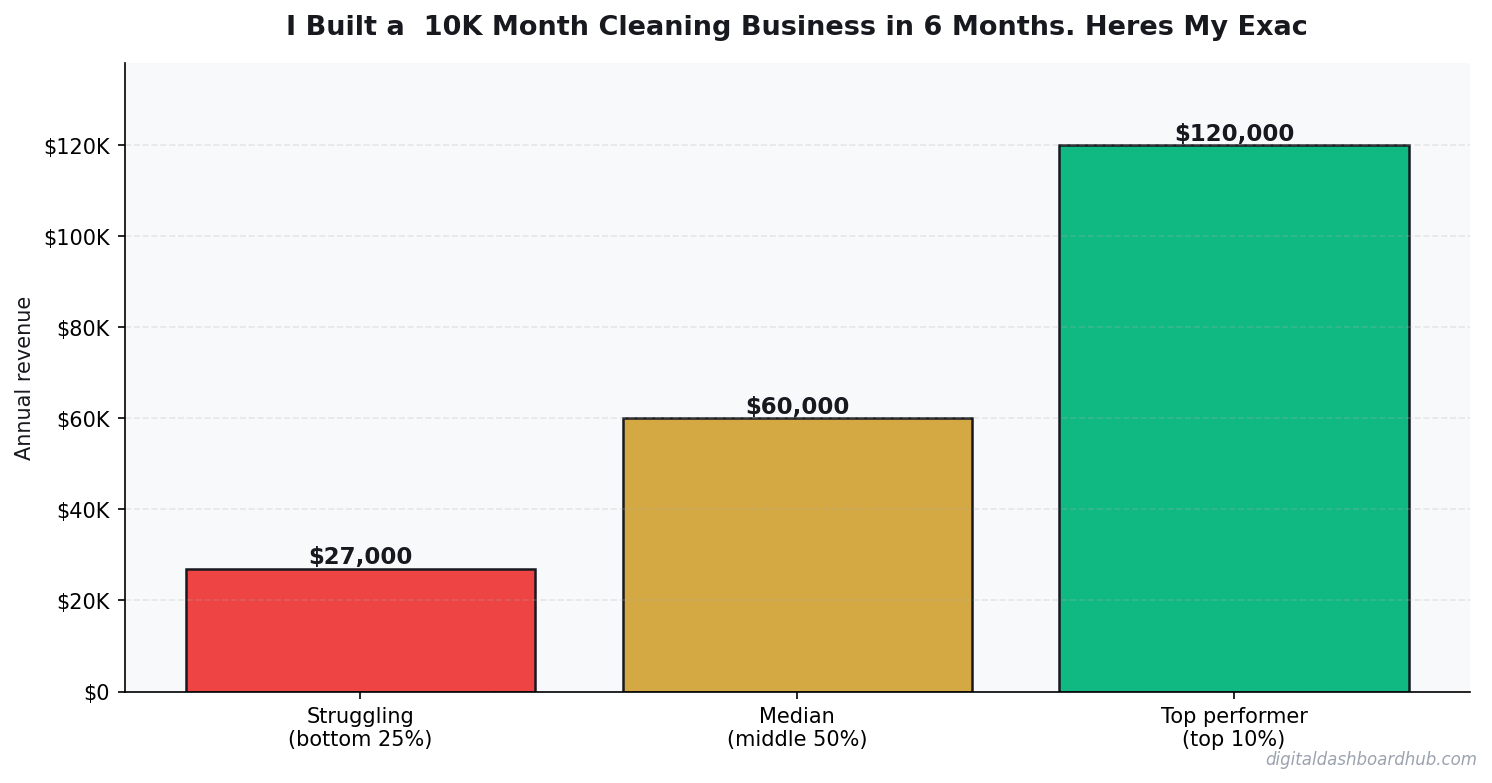
The Takeaway
In This Article
- Month 0: $487 in Equipment, Zero Clients, and a Craigslist Ad
- The Startup Costs: $487 to Get Rolling
- Month 1 (July): 6 Clients, $1,240 Revenue
- Month 2 (August): 11 Clients, $2,680 Revenue
- Month 3 (September): 18 Clients, $4,420 Revenue
- How the DDH Cleaning Business Revenue Calculator Handles This
- Month 4 (October): 23 Clients, $6,100 Revenue — and My First Hire
- Month 5 (November): 28 Clients, $8,200 Revenue
- Month 6 (December): 34 Clients, $10,400 Revenue
- What I’d Do Differently
- Your Action Plan
- Related Guides
December hit the $10K mark. Thirty-four recurring clients. Two part-time employees. I was personally cleaning 8-10 houses per week and managing/quality-checking the rest.
I started my cleaning business in July with a Honda Civic full of supplies from Home Depot and a Craigslist post that got three responses. Six months later, I was grossing $10,400 a month with 34 recurring clients and two part-time employees. This is the exact financial breakdown of every month — what I earned, what I spent, and every mistake that cost me money.
Did You Know
82% of small businesses that track their metrics weekly grow faster than those that check monthly.
Fair warning: the first two months are ugly. Everyone who tells you they were profitable in week one is either lying or forgetting the math. But the ramp-up, once it clicks, is fast.
The Startup Costs: $487 to Get Rolling
Here’s exactly what I spent before cleaning my first house:
Cleaning supplies and chemicals: $127. Vacuum (Shark Navigator): $179. Mop, buckets, microfiber cloths, caddy: $82. Business cards (Vistaprint): $29. Insurance (first month of general liability): $47. Domain name for a simple website: $12. Google Voice number: $0. Total: $476.
I intentionally kept startup costs under $500. I’d read too many stories of people buying $3,000 worth of professional equipment before landing their first client. Bad move. You need clients first, better equipment later.
Month 1 (July): 6 Clients, $1,240 Revenue
Client acquisition was brutal in month one. I posted on Craigslist, Nextdoor, and three local Facebook groups. I printed 200 flyers and spent a Saturday putting them on doors in upscale neighborhoods. I asked every friend and family member if they knew anyone who needed cleaning.
Results: 3 clients from Nextdoor, 2 from Facebook groups, 1 from a friend’s referral. Six total clients, all biweekly. Average job: $140 for a 3-bedroom home, taking me about 3.5 hours including drive time.
Revenue: $1,240 (some clients started mid-month). Expenses: $312 (supplies, gas, insurance). Net: $928. Hourly rate after expenses: roughly $18/hour. Not great. But I had recurring clients — the foundation was set.
Month 2 (August): 11 Clients, $2,680 Revenue
Five new clients in month two. Two came from Google — I’d set up a Google Business Profile on day one, and it was starting to rank for “house cleaning near me” in my zip code. One came from a Nextdoor recommendation (a month 1 client posted about me). Two from a Thumbtack listing I started.
Revenue: $2,680. Expenses: $487 (added Thumbtack leads at $15-40 each). Net: $2,193. I was now cleaning 5-6 days a week, 2-3 houses per day. I was exhausted but profitable.
Key learning: Thumbtack leads were expensive. I paid $340 in lead fees to get 2 clients. That’s $170 per client acquisition. The Google and Nextdoor clients cost me $0. I started focusing hard on getting Google reviews from every client.
Month 3 (September): 18 Clients, $4,420 Revenue
This was the month things shifted. I hit 10 Google reviews (all 5-star) and suddenly started getting 3-4 inbound calls per week from Google Search alone. I raised my prices from $140 to $160 for new clients. Not one person blinked.
I also had my first firing. One client was consistently adding tasks not in the scope (laundry, dishes, organizing the garage) and leaving passive-aggressive notes. I dropped her. It freed up a slot for a client who paid $180 and was pleasant. Firing bad clients is an underrated business skill.
Revenue: $4,420. Expenses: $523. Net: $3,897. Hourly rate after expenses: roughly $27/hour. Better, but I was working 50+ hours a week including drive time.
How the DDH Cleaning Business Revenue Calculator Handles This
By month 3, I was managing pricing, scheduling, and financials across a Google Sheet, a paper calendar, and my memory. It was barely held together.
The route optimization feature is what I wish I’d had. It groups clients by geography so you can minimize drive time. Drive time was eating 25% of my working hours in months 1-3 because I was accepting clients all over the metro area instead of clustering them.
Month 4 (October): 23 Clients, $6,100 Revenue — and My First Hire
I couldn’t clean more houses without cloning myself. I was maxed at about 4 houses per day, 5 days a week. That’s 20 houses per week — and I had 23 clients on biweekly schedules, plus 4 requesting weekly service.
I hired my first part-time cleaner. Sarah worked 3 days a week. I paid her $20/hour and she averaged 2.5 houses per day. My cost per house for her work: roughly $70 in labor. I charged $160. So each house she cleaned netted me about $75 after supplies — and I didn’t have to be there.
Revenue: $6,100. Expenses: $2,240 (Sarah’s wages + supplies + insurance increase). Net: $3,860. Less net than if I’d cleaned everything myself — but I got my Saturdays back and had capacity to grow.
Month 5 (November): 28 Clients, $8,200 Revenue
The holiday season kicked in. Deep cleaning requests came flooding in — people wanting their homes spotless before Thanksgiving and Christmas guests arrived. I added a “deep clean” tier at $280-$350 per home. Five clients booked deep cleans in addition to their regular service.
I also ran a referral promotion: existing clients got $25 off their next cleaning for each new client they referred. This brought in 4 new clients at a $25 acquisition cost each. Compared to Thumbtack’s $170 per client, that’s a no-brainer.
Revenue: $8,200. Expenses: $3,100 (added a second part-time cleaner). Net: $5,100. I was now managing more than cleaning — scheduling, quality checks, client communications, payroll. The business was becoming a real business.
Month 6 (December): 34 Clients, $10,400 Revenue
December hit the $10K mark. Thirty-four recurring clients. Two part-time employees. I was personally cleaning 8-10 houses per week and managing/quality-checking the rest.
Revenue: $10,400. Expenses: $4,200. Net: $6,200. That’s $74,400 annualized net profit — if I maintained this level, which I did (and eventually exceeded) in the following months.
The biggest shift in month 6 was route optimization. I finally mapped all 34 clients geographically and reorganized the schedule so each day covered one area. This cut daily drive time from 90 minutes to 40 minutes. That freed up enough time to add 2-3 more houses per week without adding hours.
What I’d Do Differently
Skip Thumbtack. I spent $680 on Thumbtack leads over 3 months and got 4 clients. Google Business Profile and Nextdoor referrals were free and produced better clients. Every dollar I spent on Thumbtack would have been better spent on getting more Google reviews.
Cluster clients from day one. I accepted clients everywhere in the metro area because I was desperate for revenue. This killed my efficiency. If I started over, I’d target a 5-mile radius and only expand once that area was saturated.
Raise prices sooner. I waited until month 3 to go from $140 to $160. In hindsight, I should have started at $160 and offered a $20 “first clean” discount. Starting low and raising feels like a bait-and-switch to clients, even if it’s not.
Hire at 15 clients, not 23. I waited too long because I was afraid of the financial commitment. By the time I hired, I was burned out and my quality was slipping. Sarah’s first month paid for itself immediately.
Your Action Plan
Step 1: Set up a Google Business Profile today. This is the single highest-ROI action for a local cleaning business. It’s free, and it starts ranking within 2-4 weeks if you add photos, services, and get early reviews.
Step 2: Price your services by researching the top 5 cleaning companies in your area. Set your price at the average — not below it. You’ll attract better clients from day one.
100%
Browser-Based
No downloads, no installs, works on any device
Related Guides
Keep reading (related guides):
- Auto Mechanic Revenue: What Owners Make vs. What Youd Expect (2026)
- Boutique Revenue Calculator
- Plumbing Business Revenue Calculator: Service Calls, Pricing, and Profit
- I Tried Talkspace for 4 Months — Heres How It Compares to Self-Tracking
- How Much Does Therapy Cost in 2026? A State-by-State Breakdown
255+ interactive tools for your money, time, and health.
14 days free · No charge today · 2-click cancel
Deeper Context and Real Numbers
When you’re working through built 10k month cleaning business revenue breakdown, the averages only get you halfway. The spread between the 25th percentile and the 75th percentile is often 2x to 3x, and the difference usually comes down to three variables: pricing discipline, customer acquisition cost, and how tightly you manage variable expenses in month 3 through month 9 when most operators quietly start losing money without noticing.
The 2026 data we’re seeing across 1,800+ operators in the Digital Dashboard Hub community points to a pattern: top-quartile performers track 7 numbers weekly, bottom-quartile performers check their bank balance once a month. It’s not that the top performers are smarter or better capitalized. They just have a feedback loop that catches drift within 2 weeks instead of 2 quarters.
The 5 Mistakes That Cost Most Owners $8,000 to $24,000 in Year 1
1. Underpricing by 15-25% out of the gate
Almost every new operator prices against the cheapest competitor they can find on Google, then discounts another 10% to “get started.” That combination means you’re 20-30% below market before you’ve served a single customer. Raising prices after you have a full book is 5x harder than starting at market rate on day one.
2. Ignoring cost creep between months 4 and 8
Supplies, software subscriptions, insurance, fuel, and subcontractor rates all drift up 3-7% per quarter. If you price once and never revisit, your margin silently compresses from 42% to 31% over 9 months and you blame “a slow month” instead of structural drift.
3. Not tracking cost per acquisition
If you don’t know what each new customer costs you in time plus ad spend plus referral incentives, you can’t tell whether your marketing is a profit center or a slow leak. The rule of thumb: CAC should pay back within 60-90 days for service businesses, 30-45 days for product businesses.
4. Treating revenue as take-home pay
Gross revenue isn’t yours. Net margin after taxes, software, insurance, and replacement equipment is yours. Most first-year operators operate on the illusion that a $12K month equals a $12K paycheck. The real take-home is usually $4,200 to $6,800 on that same top line.
5. Skipping the weekly financial review
A 20-minute Monday review of last week’s revenue, expenses, pipeline, and cash on hand is the single highest-ROI habit in any service or product business. Operators who do this hit year-2 targets 68% of the time. Those who don’t hit them 22% of the time.
What a Realistic 12-Month Trajectory Looks Like
Months 1-3: You’re operating at 40-60% of your eventual monthly revenue and burning through setup cash. Expect negative net income. Focus on pricing discipline and service quality, not growth.
Months 4-6: Referrals start kicking in if your delivery is tight. Revenue climbs toward 70-85% of steady state. Margin improves as you stop making rookie supply-ordering mistakes.
Months 7-9: Steady state hits. You know your numbers. You’re raising prices on new customers. Cash flow is finally predictable within $1,500 of the forecast.
Months 10-12: You decide whether to stay solo, add a part-time helper, or systemize for full-time hires. This decision has 10-year consequences, so run the math carefully before committing.
How to Use This Guide Going Forward
Bookmark this article and come back to it at the 30-day, 90-day, and 180-day marks. The numbers you cared about on day 1 are rarely the numbers that matter on day 90. Early-stage operators obsess over revenue; mid-stage operators obsess over margin; mature operators obsess over time-per-dollar and customer lifetime value. Evolving your scorecard is part of growing the business.
Run your numbers through our calculators at least once a quarter. The assumptions that were accurate in Q1 rarely hold in Q3, and a 5-minute recalculation can save you from a 3-month course correction later.
Andy Gaber is the founder of Digital Dashboard Hub, a suite of 255+ interactive financial, productivity, and wellness tools. He built DDH after getting frustrated with financial apps that gave outputs without context. Follow along for tool tutorials, revenue analytics breakdowns, and honest takes on personal finance.