
The Million-Dollar Restaurant That Pays Its Owner $50,000
The dashboard below loads instantly in your browser. Plug in your numbers, see your answer. No signup to try the basics.
Running a SaaS business means I track these numbers obsessively. Here’s what the data actually shows:
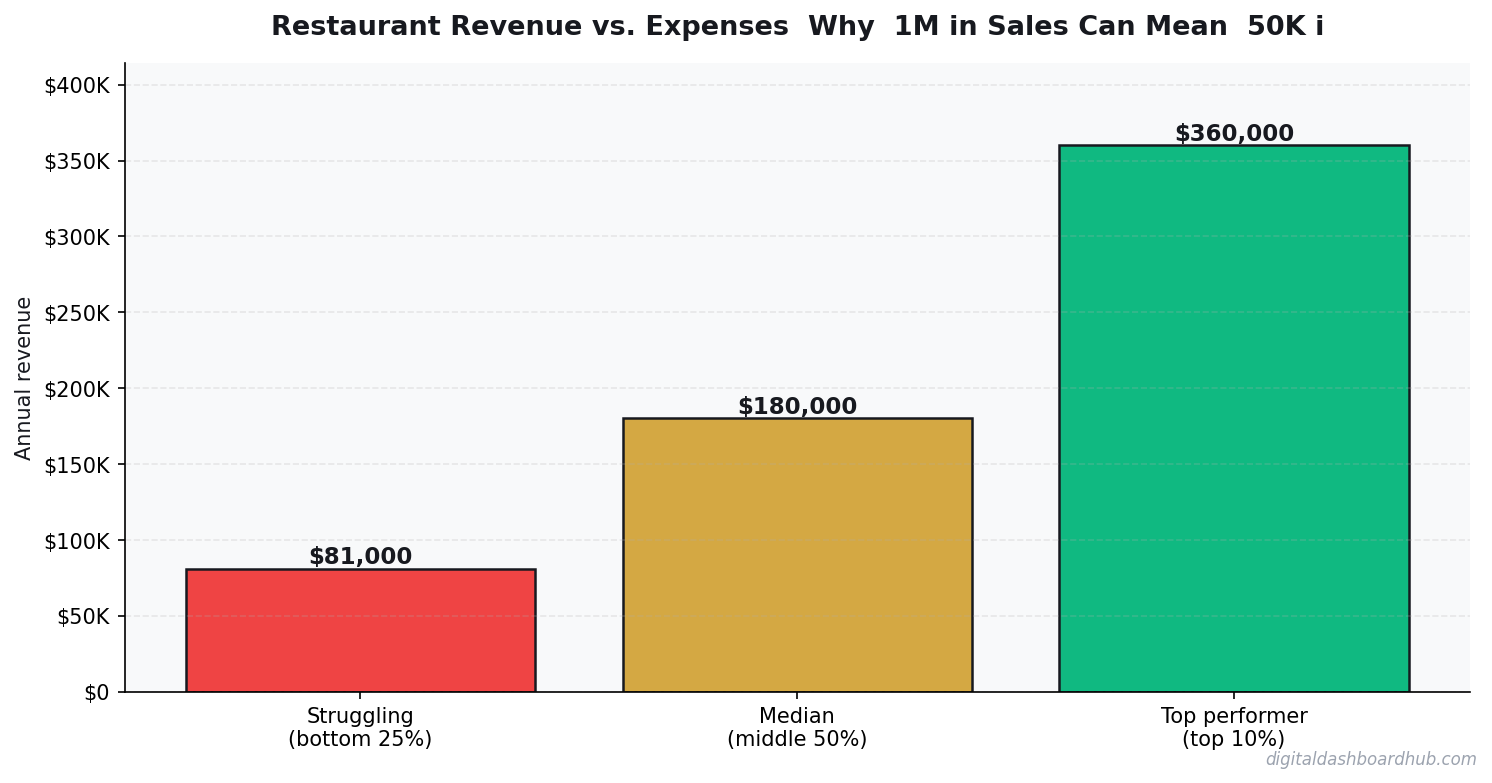
A restaurant doing a million dollars a year in sales sounds like a success story. It’s not — it’s a starting point. After food costs, labor, rent, insurance, utilities, maintenance, marketing, and the fifteen other expense categories that restaurants deal with, a $1M restaurant typically puts $30,000-$70,000 in the owner’s pocket. Sometimes less. Sometimes nothing.
The restaurant industry has the second-highest failure rate of any business category and some of the thinnest margins in any industry. Yet new restaurants open every day because the people opening them see the revenue and imagine the expenses are smaller than they actually are.
This is the real revenue vs. expense breakdown for four restaurant types — fine dining, fast casual, quick service (QSR), and food truck — so you can see exactly where the money goes and why a million dollars in sales isn’t what it sounds like.
The Four Restaurant Models Compared
Before diving into the numbers, understand that “restaurant” is not one business model — it’s at least four, each with dramatically different cost structures, revenue potentials, and owner outcomes.
*Food truck owner take-home shown on equivalent $1M revenue; most trucks gross $250K-$500K with proportionally higher margins.
The pattern is counterintuitive: the fanciest restaurants have the worst margins. Fine dining’s 2-6% net margin means that on a $2M gross, the owner might take home $40,000-$120,000 — while working 60+ hours a week and carrying $1M+ in startup debt.
Fine Dining: Beautiful Food, Brutal Margins
Fine dining has the highest revenue per table but also the highest costs in every category. A fine dining restaurant spending 32% on food, 33% on labor, 10% on rent, and 20% on other expenses has a 5% net margin before the owner draws a salary. On $2M in revenue, that’s $100,000 in profit — which sounds decent until you remember the owner invested $1M+ to build the restaurant and works 65 hours a week running it.
The labor cost is the killer. Fine dining requires trained chefs (not line cooks — chefs), sommeliers, servers who can describe dishes in detail, food runners, bussers, and front-of-house managers. You’re paying for expertise at every position. A head chef in a fine dining restaurant earns $65,000-$120,000. A head line cook at a fast casual earns $38,000-$52,000. That difference multiplies across every position.
Fine dining also has higher waste costs. Expensive proteins need to be used within narrow freshness windows. A $40 tenderloin that doesn’t sell tonight can’t be tomorrow’s daily special — it goes in the trash. Food waste in fine dining typically runs 5-8% of food purchases, compared to 2-4% in fast casual where simpler ingredients have longer shelf lives.
Fast Casual: The Model That Makes Sense on Paper
Fast casual (think Chipotle, Sweetgreen, Panera) has emerged as the most financially viable sit-down restaurant model. Higher average checks than QSR ($12-$18 vs. $8-$12), lower labor costs than fine dining (counter service vs. full table service), and a format that supports volume without requiring a full kitchen brigade.
A well-run fast casual doing $1M/year with 30% food cost, 27% labor, 9% rent, and 16% other expenses nets about $80,000-$90,000 in owner compensation. That’s a real salary. Not rich, but real — and the startup cost ($250K-$750K) is manageable compared to fine dining.
The vulnerability of fast casual is labor. In a QSR, you can operate with lower-skilled staff because the menu is highly standardized. Fast casual sits in an awkward middle ground where the food requires some skill to prepare but the price point doesn’t support chef-level wages. This means fast casual operators spend more time training and face higher turnover costs than QSR, without the margin to pay enough to reduce turnover.
Quick Service (QSR): Volume Wins
QSR — McDonald’s, Subway, Chick-fil-A — is a volume game. Low average ticket, high transaction count, standardized everything. The model is designed to be operated by minimum-wage staff following precise procedures. This keeps labor costs as a percentage of revenue lower than any other format.
An independent QSR (not franchise) doing $900,000/year can net $54,000-$81,000 for the owner. The challenge is that QSR requires extremely high daily transaction counts to reach that revenue — 200-400 transactions/day at a $7-$12 average ticket. That requires a high-traffic location, which means expensive rent, which offsets some of the labor savings.
Franchise QSR operations are a different financial model entirely. A McDonald’s franchise requires $1M-$2.2M in startup capital and pays McDonald’s 4% of gross revenue in royalties plus 4% in marketing fees. An average McDonald’s grosses $3.1M/year, netting the franchisee $150,000-$250,000. Great income, massive capital requirement.
Food Truck: Highest Margins, Lowest Ceiling
Food trucks have the best percentage margins in the restaurant industry because they eliminate the biggest fixed cost: rent. A food truck’s “rent” is a parking permit ($100-$500/month in most cities) plus commissary kitchen rent ($500-$1,500/month). Total occupancy cost: $600-$2,000/month vs. $5,000-$15,000/month for a brick-and-mortar restaurant.
A food truck grossing $350,000/year with 30% food cost, 22% labor (often owner-operated), 4% occupancy, and 14% other expenses nets roughly $35,000-$42,000 for the owner. On a percentage basis, that’s a 10-12% net margin — double fine dining. But the dollar amount is lower because the revenue ceiling is lower.
The food truck ceiling is physical: you can only serve so many customers through a window in a day. Most trucks max out at 150-200 orders/day during peak hours. At a $10 average ticket, that’s $1,500-$2,000/day, but you only operate 200-250 days/year (weather, maintenance, event schedules). Annual max: roughly $375,000-$500,000.
How the DDH Restaurant Revenue Calculator Handles This
Restaurant finances have more variables than almost any other small business. Food costs fluctuate seasonally. Labor costs vary by state minimum wage. Rent varies by neighborhood. Utilities spike in summer (cooling a kitchen is expensive). Modeling all of this accurately requires a tool built specifically for food service.
The DDH Business Revenue Calculator includes a restaurant-specific module that lets you select your format (fine dining, fast casual, QSR, food truck), input your market, and model revenue based on average ticket, daily covers, and operating days per week. It then applies industry-standard cost percentages with adjustments for your specific inputs.
The feature that restaurant owners tell me they use most is the labor scheduling optimizer. It shows you how much you’re spending on labor during your slow hours versus your peak hours, and models the impact of cutting one shift during slow periods. That single adjustment — trimming 15-20 hours/week of underutilized labor — often adds $20,000-$35,000/year to the bottom line without affecting service quality.
Mid-Article Bonus: The Prime Cost Rule
The most important number in restaurant finance is prime cost: food cost + labor cost combined. Industry rule: prime cost should be 55-65% of revenue. Below 55% usually means you’re understaffing or using cheap ingredients (quality suffers). Above 65% means you’re overstaffing or over-spending on food (profit suffers).
Most failing restaurants have a prime cost above 70%. At 70% prime cost with 10% rent and 15% other expenses, your net margin is 5% — before owner compensation. At a realistic owner salary of $50,000-$70,000, you need $1M+ in revenue just to cover the owner’s pay at 5% margin. This is why so many million-dollar restaurants have struggling owners.
Track your prime cost weekly. Not monthly — weekly. Food prices fluctuate, staff hours creep up, and by the time you catch a prime cost problem at month-end, you’ve already lost 4 weeks of margin. The restaurants that survive are the ones watching this number like a hawk.
Why $1M in Revenue Feels Like $50K
Let’s trace exactly where one million dollars goes in a fast casual restaurant:
Revenue: $1,000,000. Food and beverage cost: $300,000 (30%). Labor (including taxes and benefits): $280,000 (28%). Rent and occupancy: $90,000 (9%). Utilities: $30,000 (3%). Insurance: $15,000 (1.5%). Marketing: $20,000 (2%). Equipment maintenance and repair: $18,000 (1.8%). Credit card processing: $25,000 (2.5%). Paper goods and supplies: $20,000 (2%). Licenses and permits: $5,000 (0.5%). Accounting and legal: $8,000 (0.8%). Waste removal: $6,000 (0.6%). Technology (POS, online ordering): $9,000 (0.9%). Miscellaneous: $12,000 (1.2%). Total expenses: $838,000. Loan/equipment payments: $36,000. Pre-tax profit: $126,000. Taxes: $31,500. Net to owner: ~$94,500.
That’s a well-run fast casual at optimal percentages. Most restaurants aren’t well-run. They’re 2-3 percentage points over budget in two or three categories, which turns that $94,500 into $50,000 or less. The margin for error in restaurants is razor-thin because the expenses are so numerous and each one can quietly creep above target.
The Expenses Nobody Budgets For
Every restaurant owner I’ve interviewed has been surprised by at least two costs they didn’t budget for. The most common: equipment repair ($5,000-$15,000/year — commercial ovens, walk-in coolers, and dishwashers break constantly), grease trap cleaning ($2,400-$4,800/year, required by health code), and staff meals (feeding your team costs $3,000-$8,000/year and is expected in the industry).
Credit card processing is another one that blindsides new owners. At 2.5% of revenue, a $1M restaurant pays $25,000/year just to let customers use credit cards. In 2026, with 80%+ of transactions being card-based, this is a cost you cannot avoid and cannot negotiate significantly. It’s essentially a 2.5% tax on revenue that comes straight off the top.
Do This First
Step 1: Calculate your prime cost target. Add your projected food cost percentage and labor cost percentage. If it’s above 65%, your plan needs revision before you spend a dollar on buildout.
Step 2: Get real numbers for your market. Talk to local restaurant owners, check local commercial lease rates, and research your state’s minimum wage trajectory. National averages mean nothing if your market is 20% more expensive than average.
Step 3: Model your restaurant’s P&L in the DDH Revenue Calculator to see the full expense picture — every line item, every percentage — before you commit capital. The calculator doesn’t tell you whether to open a restaurant. It tells you what it’ll actually cost and what you’ll actually make.
Explore More
- Side Hustle Income & Tax Tracker (Free Tool)
- How Sinking Funds Saved Me From Financial Emergencies
- Freelancer Finance Dashboard
Keep reading (related guides):
- Business Expense Tracker: Categorize and Export for Tax Time
- How Much Money You Need to Retire Early at 40, 45, and 50 (Real Numbers by Age)
- I Keep Losing Money to Impulse Spending: Heres My Fix
- Debt Snowball vs Avalanche Calculator: Which Method Saves You More Money
- Free Menopause Symptom Tracker — Try It Now
255+ interactive tools for your money, time, and health.
Full dashboard access · Stripe-secure checkout · Cancel anytime
Andy Gaber is the founder of Digital Dashboard Hub, a suite of 255+ interactive financial, productivity, and wellness tools. He built DDH after getting frustrated with financial apps that gave outputs without context. Follow along for tool tutorials, revenue analytics breakdowns, and honest takes on personal finance.