Use the free Barber Shop Revenue Calculator below — plug in your real numbers and get instant results. No signup required for the lite version.
Try the Barber Shop Revenue Calculator
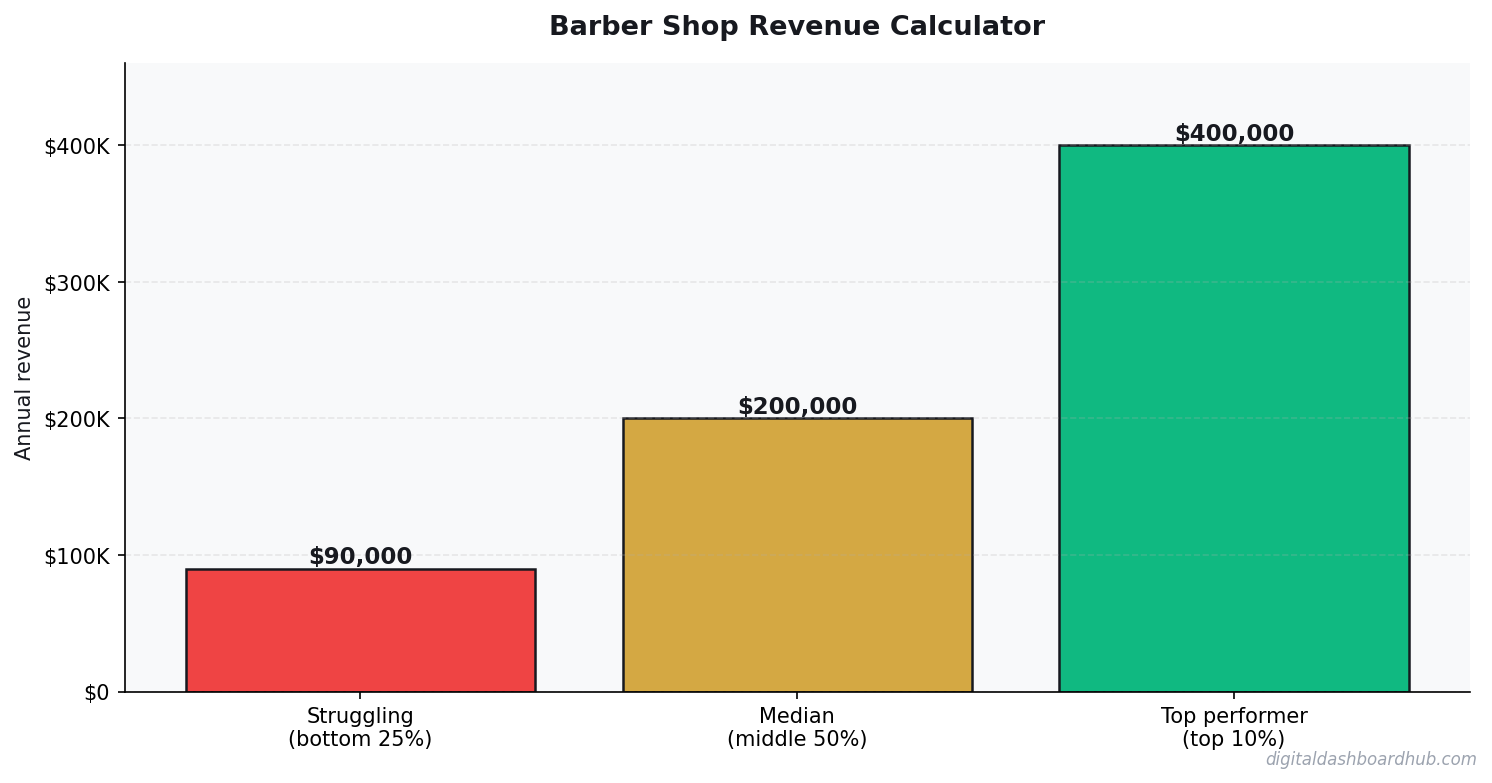
Barber Shop Revenue Calculator
Enter your numbers below — results update instantly
Want the full Barber Shop dashboard with expense tracking, break-even analysis, and growth projections?
Why This Matters
Running numbers in your head is how bad financial decisions happen. A quick calculation with real data beats a gut feeling every single time. I built this tool because I was tired of spreadsheet gymnastics just to answer basic questions about my finances.
The calculator above handles the basics. But if you need trend tracking, scenario comparison, and exportable reports — the full version inside Digital Dashboard Hub does all of that and more.
What You Get in the Full Dashboard
| Approach | Startup Cost | Time Investment | Revenue Potential | Best For |
|---|---|---|---|---|
| Solo operator | Low ($1K-$10K) | Full time | $60K-$200K/yr | Maximum margins, full control |
| Small team (2-5) | Medium ($10K-$50K) | Management + some fieldwork | $200K-$800K/yr | Scaling without losing control |
| DDH Revenue Tracker | Free trial | 5 min setup | N/A (profit tool) | Know your real numbers in real time |
The full Barber Shop Revenue Calculator inside DDH includes features the lite version above can’t offer:
- Historical tracking — see your numbers change over weeks and months
- Visual charts — bar graphs, trend lines, and breakdowns that make patterns obvious
- Scenario modeling — “what if I change X?” comparisons side by side
- PDF reports — export professional reports for partners, lenders, or your own records
- — one subscription covers every calculator and tracker in the library
How to Use This Tool
Step 1: Enter your actual numbers in the fields above. Don’t guess — pull from your bank statements or business records for the most accurate results.
Step 2: Read the output cards. They update instantly as you type. Play with different scenarios to see how small changes affect your bottom line.
Step 3: If you want to save your results, track changes over time, or run more advanced projections — start a free 14-day trial of the full dashboard. No credit card required.
Your Next Move
You’ve already done the hardest part — you looked at your numbers instead of avoiding them. Here’s what to do with that momentum:
- Right now (30 seconds): Bookmark this page so you can rerun the calculation next month
- This week: Pull your real numbers from your accounts and run them through the calculator above
- Long game: Try the full DDH dashboard — 261 tools, 14 days free, cancel anytime
Keep Going
- How to Save $10,000 in 6 Months: A Realistic Plan That Actually Works
- How Sinking Funds Saved Me From Financial Emergencies — Free Template Inside
- Micro-Business Operations Dashboard (CSL): Your All-in-One Command Center for Running a Lean Business
Common Questions About Barber Shop Revenue Calculator
How long does it take to see results?
Most people see meaningful progress within 30-90 days when they apply these strategies consistently. The key is tracking your numbers from day one so you have a baseline to measure against.
What’s the biggest mistake people make?
Trying to do everything at once. Pick one or two strategies from this guide, implement them fully, then layer in additional tactics. Spreading yourself thin is the fastest way to see no results from any of it.
Do I need special tools or software?
Not necessarily to start — but the right tools eliminate hours of manual work. Our free calculators and trackers at Digital Dashboard Hub are a good starting point before you invest in paid software.
A Barber Shop That’s Actually Crushing It: The Numbers
A 4-chair barber shop in Austin, open 6 days a week. Each chair runs 8 clients/day at $35 average ticket (a mix of $28 basic cuts and $45 fade/style combos). That’s $1,120/day per chair, or $4,480/day across the shop. Run 300 days a year and you’re at $1,344,000 in gross revenue.
Now strip it down. Barber booth rent or commission averages 40-50% to the operators — call it $620,000 leaving the building. Rent for a 1,200 sq ft space in a decent Austin location: $4,500/month or $54,000/year. Supplies, utilities, insurance, point-of-sale software: another $36,000. You’re netting approximately $234,000 as the shop owner. That’s without touching a pair of clippers yourself.
The shops that struggle are usually the ones running on appointment-only with no walk-in strategy. Walk-in volume is the lifeblood of a barber shop. Appointments are great for regulars, but a shop that’s hard to walk into is a shop that loses every customer who’s new to the neighborhood.
The 3 Things That Move Barber Shop Revenue Most
1. Chair utilization rate. A chair sitting empty is a chair bleeding money. Top shops target 75-85% utilization during operating hours. If you’re running 4 chairs but only 2.5 are productive at any given time, you’re either overstaffed or your scheduling is broken. Fix that before you think about marketing.
2. Average ticket, not just client volume. Getting a client in the chair is the hard part. Getting them to add a beard trim ($10-$15), hot towel treatment ($8), or a styling product ($15-$25) at checkout is a pure margin play with zero additional foot traffic required. Shops that train their barbers on add-ons routinely run $45-$55 average tickets instead of $28-$35.
3. Retention, not just new client acquisition. A client who comes in every 3 weeks is worth $600+/year. A client who comes in once and never comes back is worth $35. The economics of retention are so much better than acquisition that any shop spending on ads without first nailing the in-chair experience is spending backwards.
What the Best Barber Shops Do Differently
They build a brand identity, not just a service menu. A barber shop with a defined aesthetic — whether that’s vintage barbershop, modern streetwear-adjacent, or luxury grooming — attracts a specific customer who’s willing to pay for the experience, not just the cut. Generic shops compete on price. Shops with an identity charge 20-30% more and stay fully booked.
The operational discipline in the best shops is also notable. They track their chair utilization weekly. They know their no-show rate and send reminder texts to reduce it. They track retail product sales per barber, not just per shop — because a barber doing $200/month in product revenue is creating pure margin with no additional foot traffic, and that deserves to be measured and rewarded.
The shops that fail — and a lot do — usually fail on the people side, not the money side. A star barber with a following leaves, and 40% of the clientele follows them out the door. The shops that survive this have built shop loyalty, not individual-barber loyalty, through the brand, the environment, and the booking system. The customer relationship lives with the shop, not just the individual.
Seasonal Patterns and How to Plan Around Them
Barber shop revenue is surprisingly seasonal. Holidays drive volume spikes — the weeks before Thanksgiving, Christmas, and back-to-school are legitimately busy. February and early March are often the slowest months of the year. Plan staffing and cash reserves accordingly.
Some shops counter slow periods with promotions. A February “bring a friend” discount can drive new client acquisition at a time when you have available chair time. Others use slow periods for renovations, staff development, or building the marketing infrastructure they don’t have bandwidth for during peak months. Either approach works — the worst approach is being surprised by a slow February every single year.
Keep reading (related guides):
Full features for 14 days · Secure payment · Stop anytime
Andy Gaber is the founder of Digital Dashboard Hub, a suite of 255+ interactive financial, productivity, and wellness tools. He built DDH after getting frustrated with financial apps that gave outputs without context. Follow along for tool tutorials, revenue analytics breakdowns, and honest takes on personal finance.