The first bookkeeper I ever interviewed for this project opened a spreadsheet, squinted at it for about ten seconds, and said: “I’m making $65 an hour.” Then she paused. “I think.” Then she scrolled down, saw her QuickBooks Online subscription, her E&O insurance premium, her Ignition fee, the hours she didn’t bill for onboarding calls, and went quiet. By the time we were done with the math, her real number was closer to $19/hour. She was working 50-hour weeks at an effective rate below what her local coffee shop pays a shift lead.
I’m Andy, founder of Digital Dashboard Hub. I built the free Bookkeeper Revenue Calculator below because I kept running into this exact conversation. Solo bookkeepers who look profitable on paper. Small firms grossing $180K/year and netting $40K. People billing by the hour and feeling good about the rate — with no idea what happens after software, insurance, unbilled admin, and the three hours a week they spend on “quick client texts.”
This article has two jobs. First, walk you through real bookkeeper revenue data so you know what “normal” looks like. Second, show you how the calculator turns your specific numbers into a profit picture you can actually trust. Run your numbers once, and you’ll probably raise your rates by Friday.
Use the Free Bookkeeper Revenue Calculator
Bookkeeper Revenue Calculator
Enter your numbers below — results update instantly
Want the full Bookkeeper dashboard with expense tracking, break-even analysis, and growth projections?
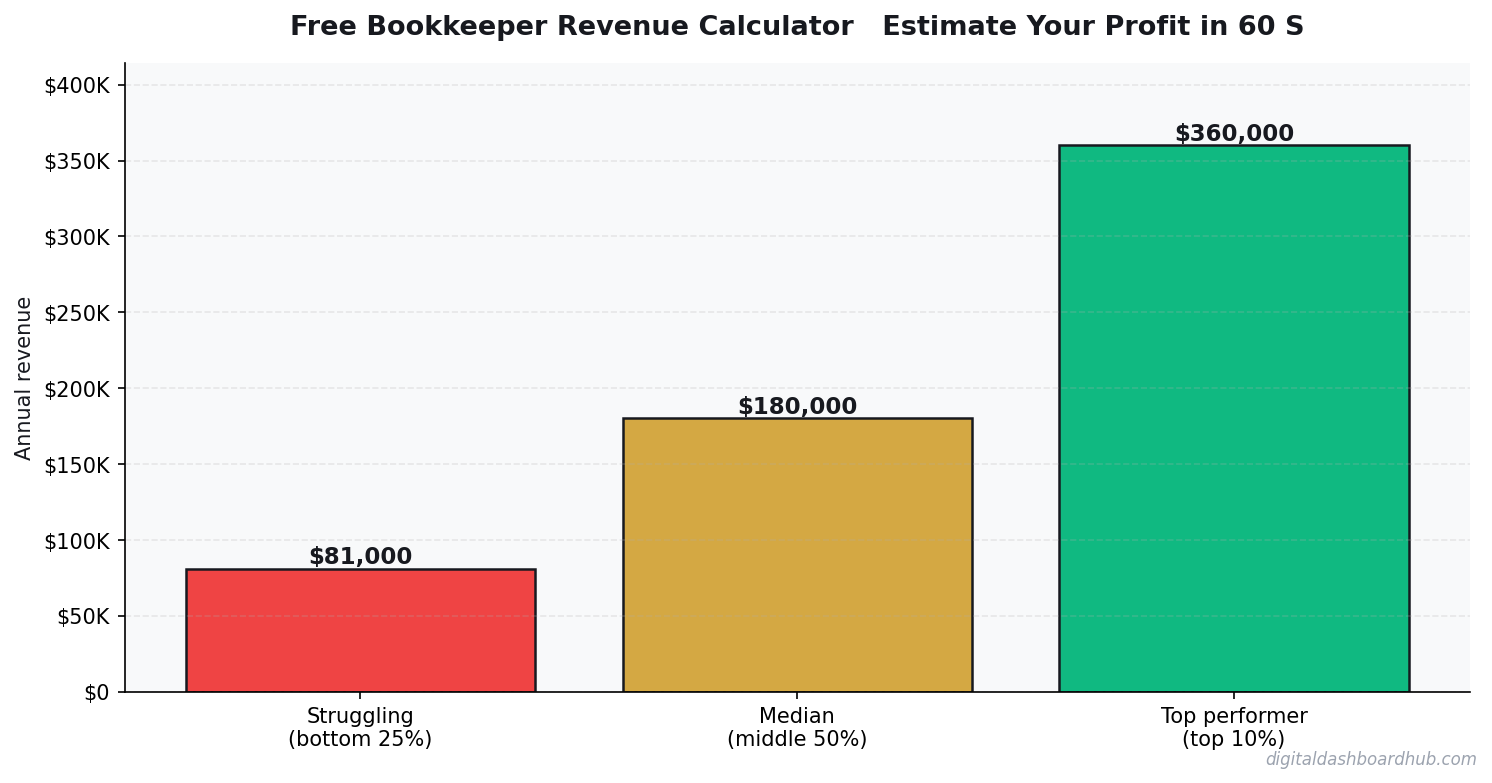
What Bookkeepers Actually Earn (The Real Numbers)
When I was talking to bookkeepers for this project — about 40 of them across the U.S. and Canada — the revenue range was wider than I expected. Solo bookkeepers working part-time were pulling $40K/year. Full-time solos with a solid retainer book were at $95K-$130K. Small firms with two to four staff were grossing $180K-$250K but netting far less than the solo operators once payroll came out.
Here’s what the numbers look like when you break them down by business model:
| Model | Annual Revenue | Net Profit Margin | Typical Take-Home |
|---|---|---|---|
| Solo, hourly billing | $40K–$80K | 25–35% | $12K–$28K |
| Solo, monthly retainer | $95K–$180K | 55–75% | $55K–$130K |
| Small firm (2–4 staff) | $180K–$350K | 15–30% | $35K–$85K/owner |
| Virtual firm (retainer only) | $120K–$300K | 60–80% | $75K–$220K |
The single biggest variable isn’t how many clients you have. It’s whether you bill hourly or on retainer. Hourly bookkeepers cap out around $75K because they’re selling time, and time runs out. Retainer bookkeepers routinely clear $130K solo because they’re selling outcomes — and every efficiency gain goes straight to the bottom line.
The Expense Categories You’re Probably Underestimating
Most bookkeepers I’ve worked with track three expenses: software, insurance, and maybe a co-working fee. The actual cost stack is much deeper, and that’s where the margin disappears.
That non-billable admin line is what kills margins. If you work 50 hours a week and 12 of those are onboarding calls, software troubleshooting, client texts, and bank reconciliation cleanup you never quoted for, your effective hourly rate drops by 24% before you notice. The calculator above lets you plug that in as “overhead %” and see what your real annual profit looks like once reality gets factored in.
How the DDH Bookkeeper Revenue Calculator Handles This
The calculator is deliberately simple. Four inputs. Three outputs. But the math underneath is built from the patterns I saw across those 40 conversations, so the defaults aren’t arbitrary — they’re calibrated to real bookkeeper businesses.
Step 1: Enter your monthly client count. Not total clients ever. Active, paying, this-month clients. If you do a mix of monthly retainers and quarterly cleanups, count each quarterly client as 0.33. The default of 25 is typical for a full-time solo bookkeeper with a mix of small-business retainers.
Step 2: Enter your average ticket. This is average revenue per client per billable event. For retainer work, divide monthly retainer by days worked on that client per week. For project/hourly, use your effective rate times average job hours. If you’re guessing, pull last month’s Stripe or QBO data and divide total revenue by total transactions.
Step 3: Set overhead honestly. This is where most bookkeepers lie to themselves. The default of 65% sounds high — but once you include software, insurance, payroll fees, unbilled admin hours valued at your target rate, self-employment tax (15.3%), and health insurance (if you’re solo), 65% is actually conservative for most. If you’re below 40%, you’re probably forgetting something. The tool recalculates monthly revenue, annual revenue, and annual profit the second you change any input.
The full dashboard version adds expense categories as line items, scenario modeling (what happens if you raise rates 15%?), and month-over-month tracking so you can see whether your margin is trending up or down. It’s part of the same approach we take to analyzing actual income data across every type of small business — stop estimating, start measuring.
Solo vs. Firm vs. Accounting Software: Which Model Wins?
One question I get constantly: should I stay solo, hire staff, or lean into automated accounting software to take on more clients without hiring? Here’s how the three approaches compare based on the data I’ve collected:
| Approach | Revenue Ceiling | Time Freedom | Best For |
|---|---|---|---|
| Solo + retainers | ~$180K | High (20–30 hrs/wk) | Bookkeepers who want lifestyle + margin |
| Small firm (2–4 staff) | $500K+ | Low (management overhead) | Operators who like building teams |
| Solo + automation stack | ~$250K | Medium (systems work) | Tech-forward bookkeepers scaling through software |
The data surprised me: solos with a tight automation stack (QBO + Keeper + Uncat + auto-categorization rules) often out-earn small firms on a per-owner basis, because they keep 70%+ margins instead of absorbing staff costs. Before you hire, try automating.
The Contrarian Take: Most Bookkeepers Underprice by 30–40%
Here’s the uncomfortable truth: almost every bookkeeper I’ve run through this calculator is underpriced by 30–40%. Not because their hourly rate is too low — because they forget to count non-billable hours. A bookkeeper quoting $75/hour who spends 12 hours a week on unbilled admin is actually working for about $51/hour. After software, insurance, and self-employment tax, that’s $28/hour net. Entry-level W-2 accounting jobs pay more than that with benefits.
The fix isn’t raising your hourly rate. The fix is switching to fixed monthly retainers that build non-billable time into the price. A $600/month retainer for a client that takes you five hours works out to $120/hour effective — and when you get faster (which you will), the rate goes up automatically. Hourly billing punishes efficiency. Retainer billing rewards it. This is the same principle behind personal savings rate — measure the output that actually matters, not the vanity metric.
When I worked with that first bookkeeper — the one who thought she was making $65/hour — we moved her three biggest hourly clients to $450/month retainers. Her gross revenue went down by 8% for one month. Her profit went up 34%. Within 90 days she’d added two more retainer clients to fill the gap and was netting $41/hour actual instead of $19/hour.
Founder Aside: Why I Care About This Specific Tool
I built this because that first bookkeeper conversation wouldn’t leave my head. She was making $65/hour and feeling successful — until I showed her she was netting $19/hour after software, insurance, and unbilled admin time. She’d been running her business for six years. Six years of working 50-hour weeks for barely-above-minimum-wage net pay, because no one had ever sat down with her and done the full math.
That’s why this tool does the full math on the first screen — revenue, overhead, profit, annual take-home — instead of hiding the profit number behind three upsells. If you’re a bookkeeper and you haven’t run your actual numbers in the last 90 days, please do it right now. It takes 60 seconds, and the result might change your 2026. Pair it with good tax planning for small business owners and you’ll have a clearer financial picture than most bookkeepers give their own clients.
Your 3-Step Action Plan
Step 1: Run your real numbers through the calculator above. Don’t use round numbers. Use last month’s actual client count, actual average ticket, actual days worked, and honest overhead (hint: 60-70% for most solo bookkeepers). Write down your net profit number.
Step 2: Identify your three lowest-margin clients. These are usually hourly clients, clients with scope creep, or clients you inherited from a referral and never re-priced. Either move them to retainer at a higher effective rate or drop them. If you don’t have client-level margin data, tracking every business expense by client is step zero.
Step 3: Add one high-margin service to your existing clients. Payroll processing ($50-$150/client/month) is the highest-margin add-on because you already have the client’s financial data. Ten existing clients adding payroll = $500-$1,500/month in 90% margin revenue. Same structural principle shows up when you look at contractor vs employee income comparison — small structural shifts produce outsized financial results.
Ready to Run the Full Numbers?
Run your numbers. If the profit line is smaller than you hoped, the calculator just did you a favor — now you know what to fix. If it’s bigger, congratulations, you’re in the top 20% of bookkeepers by margin and you can stop reading articles like this one.
— Andy Gaber, Founder, Digital Dashboard Hub
Keep reading (related guides):
255+ interactive tools for your money, time, and health.
Full dashboard access · Stripe-secure checkout · Cancel anytime
Andy Gaber is the founder of Digital Dashboard Hub, a suite of 255+ interactive financial, productivity, and wellness tools. He built DDH after getting frustrated with financial apps that gave outputs without context. Follow along for tool tutorials, revenue analytics breakdowns, and honest takes on personal finance.