Opening a CrossFit box sounds like a passion project that prints money — athletes paying $150-$200/month, a loyal community, no insurance-driven liability the way a boxing gym has. The reality is that most CrossFit affiliate owners work 60+ hours/week to net $40-$60K their first two years. I’m Andy, founder of Digital Dashboard Hub, and I’ve spent the last six months sitting across the table from gym owners who thought they were profitable until we counted the hours they were working but not paying themselves.
This article walks through the actual revenue math for a CrossFit affiliate in 2026 — what a box grosses, what it nets, and the one metric that quietly decides whether you’re building equity or buying yourself a job.
Use the Free CrossFit Gym Tool
Before you scroll: the calculator below is running in your browser right now. For the full feature set — saved scenarios, history, exports — open the dashboard.
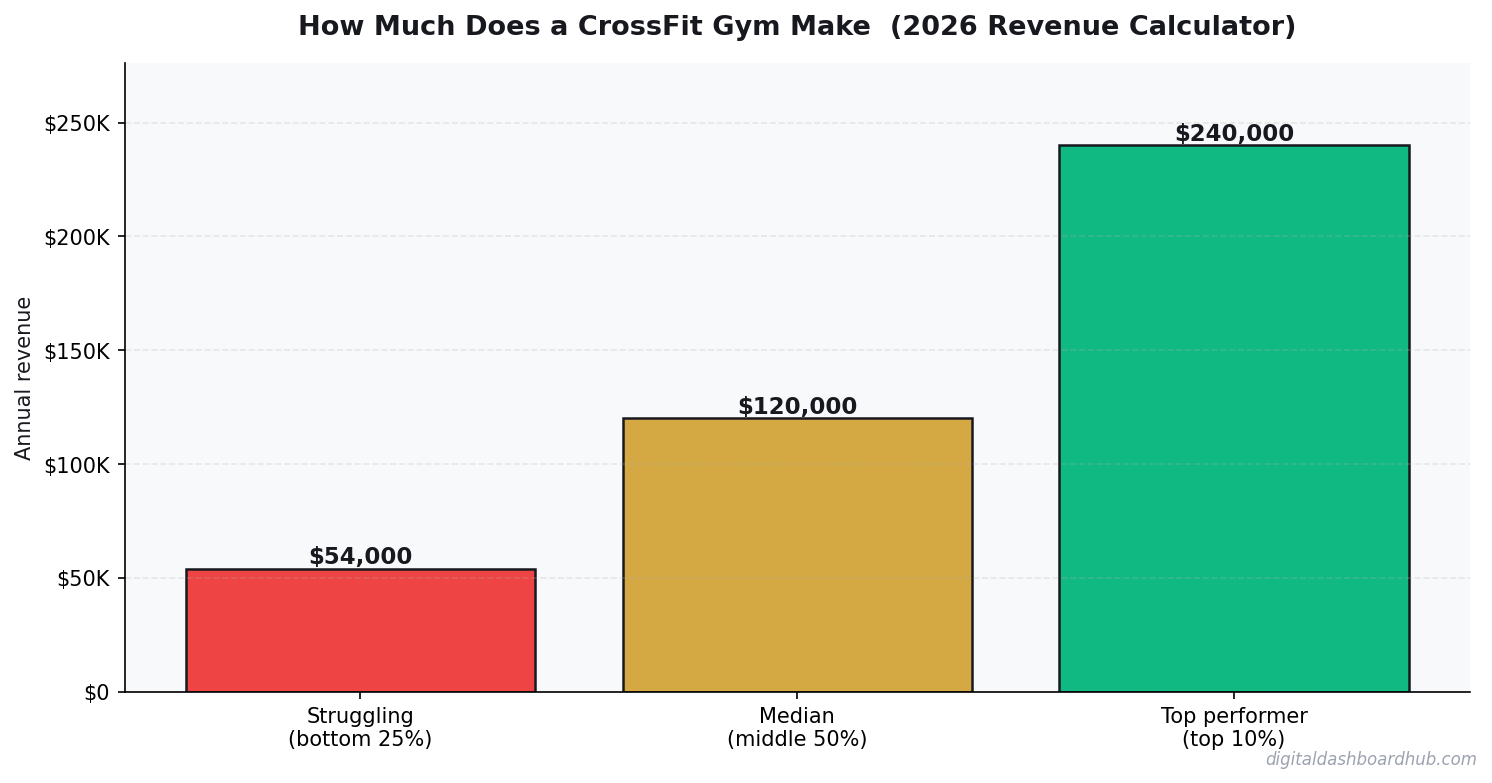
The Real Numbers Behind CrossFit Gym Revenue
The CrossFit Affiliate economic survey data I trust the most puts the average box at $150K-$350K gross annual revenue. That’s a huge range, and it’s range for a reason — a 95-member box in suburban Denver charging $165/month is a completely different business than a 220-member box in Brooklyn charging $245/month.
Here’s what the gross looks like broken down:
- Monthly membership: $120-$200 in most markets, $200-$250 in high-cost cities
- Break-even member count: 60-75 members for a 2,500 sq ft space with one owner-coach
- Monthly churn rate: 3-5% industry average, 1-2% for the top 10% of boxes
- Equipment startup: $20-$50K for a full rig, rowers, bikes, rubber flooring, and barbells
- CrossFit affiliate fee: $3,000/year flat (this is the number most people get wrong — it’s not a royalty percentage)
The “how much does a CrossFit gym make” Google answers collapse all of this into a single number. They’re useless because they ignore the three variables that actually move the needle: your member count, your monthly churn, and how much of your own unpaid labor you’re burning to keep the doors open.
A Real Example From a Denver Box Owner
I ran these numbers with a gym owner in Denver last month. He was convinced he was profitable. Here’s what we found when we actually sat down and counted:
$53,700 divided by 3,484 hours per year works out to $15.40/hour. That’s what this owner was actually earning before we restructured his class schedule and cut two underperforming time slots. The point isn’t that the business was failing — it wasn’t. The point is that “profitable” and “worth your time” are two different questions, and the average gym owner never asks the second one.
The Metric Everyone Ignores: Monthly Churn
Everybody in the CrossFit world talks about member count. Member count is the vanity metric. The number that actually predicts whether your box will still be open in five years is monthly churn rate.
Here’s the math. A gym with 120 members and 5% monthly churn is losing 6 members every single month. To stay flat at 120, you need to sign 6 new members every month. To grow to 150, you need to sign 8-10. That’s a full-time sales job on top of coaching, programming, and running the business.
Now take that same gym and drop churn to 2%. You’re losing 2-3 members a month. You need 3 new sign-ups to stay flat, and any month you sign 5+ you’re growing. Same gross revenue, completely different amount of work.
This is why the box owners I know who actually hit $100K+ in owner take-home obsess over retention — the intro program, the 90-day check-in, the nutrition add-on that doubles as a retention tool. They’re not trying to fill the top of the funnel faster. They’re trying to stop the bottom from leaking.
CrossFit Affiliate vs Independent Gym vs Boutique Studio
If you’re still choosing a model, this comparison matters more than anyone tells you:
| Factor | CrossFit Affiliate | Independent Gym | Boutique Studio |
|---|---|---|---|
| Startup cost | $50-$100K | $75-$150K | $150-$400K |
| Brand recognition | High (built-in) | Zero (you build it) | Medium-High |
| Affiliate/royalty fees | $3K/year flat | $0 | 5-8% of gross |
| Avg monthly price | $150-$200 | $40-$80 | $150-$250 |
| Revenue ceiling | $350-$500K | $200-$400K | $500K-$1.2M |
| Owner hours to start | 60-70/week | 50-60/week | 60-80/week |
CrossFit’s strength is the $3K flat affiliate fee and the built-in brand. Boutique studios can scale higher but eat 5-8% in royalties forever, which is a permanent tax on your hard work. Independent gyms have no ceiling but also no floor — you’re writing the playbook from scratch while also running the business.
How the DDH CrossFit Revenue Calculator Handles This
The lite tool above uses daily customer count and average ticket because it works for fast math. The full calculator inside Digital Dashboard Hub switches to the metrics box owners actually track: member count, average monthly membership, monthly churn rate, fixed overhead, and variable overhead.
When you plug in those four numbers, the dashboard shows you:
- Projected gross and net revenue — monthly, quarterly, and annual views
- Break-even member count — how many members you need to cover your fixed costs
- Monthly churn cost — literal dollar value of the members walking out the door each month
- Lifetime member value — calculated from your actual churn, not an industry average
- Scenario comparison — side-by-side what happens if you raise prices 10%, cut churn 2 points, or add a nutrition upsell
That last one is where most owners get the biggest aha moment. Raising prices $20/month looks scary. Running the scenario shows it adds $26,400 in annual revenue for a 120-member box and usually loses you 3-5 members — a net win of about $20K. You either see that on a dashboard or you keep talking yourself out of the price increase every year.
What the Full Dashboard Tracks
The lite tool above gives you a quick answer. The full CrossFit Gym Revenue Calculator inside Digital Dashboard Hub goes way deeper:
- Historical tracking — log your numbers weekly and watch trends emerge over months
- Visual charts — bar graphs, trend lines, and breakdowns that make patterns impossible to miss
- Scenario modeling — run “what if” comparisons side by side before making decisions
- PDF reports — export clean reports for partners, lenders, or your own records
- — one subscription covers every calculator and tracker in the library, including tools for tracking overhead expenses across every category
What Most Gym Owners Get Wrong About “Profit”
Gross revenue is easy. Net revenue looks easy but isn’t. The part that almost nobody accounts for is owner’s wage — and that’s the difference between running a profitable business and running a profitable-looking business.
If you’re working 60 hours/week and only paying yourself $40K, the market rate for a general manager in that role is probably $65-$75K. The $25-$35K difference isn’t profit, it’s a subsidy you’re giving the business out of your own labor. That matters a lot when it comes time to sell the box — a buyer is going to normalize owner comp, and suddenly the $60K “profit” is a $15K profit once they hire someone to do what you were doing.
This is the same logic that applies to breaking down real vs projected income in any solopreneur business, and it’s the same reason a business owner vs employee income comparison tends to flip once you factor in unpaid hours.
Three Steps to Useful Numbers
Step 1: Enter your real numbers in the calculator above. Estimates work, but real data from your gym management software or bank statements gives you something you can actually act on. The main inputs to pull: active member count, monthly membership average, fixed monthly overhead, and last 90-day churn rate.
Step 2: Change one variable at a time and watch what happens. Price, member count, churn, overhead — move each one and see which lever is biggest for your specific box. For most owners I’ve talked to, the answer is churn. For a few, it’s a price increase they’ve been putting off. The calculator shows you which.
Step 3: Once you know your real take-home, allocate a savings rate against it before you spend a dollar on lifestyle. Building savings as a gym owner is non-negotiable because the business income is lumpier than a W-2 job. And plan your small business tax planning early — self-employment tax at 15.3% on top of federal and state will eat you alive if you don’t set aside quarterly.
Where to Go From Here
- Right now (30 seconds): Bookmark this page so you can rerun the numbers next month
- This week: Pull your actual member count, average monthly membership, and 90-day churn rate from your gym software. Run them through the calculator with real numbers instead of estimates.
- This month: Pick the one variable the calculator says moves your profit the most — price, churn, or overhead — and run one experiment against it. Measure for 30 days.
- Long game: Try the full DDH dashboard — 255+ tools, 14 days free, cancel anytime. Try the CrossFit Revenue Calculator Free →
Related Tools and Articles
- Depression Mood Tracker: How Tracking Your Mental Health Data Helps You Heal
- Amazon FBA Revenue Calculator: What Sellers Actually Make in 2026
- The Complete Guide to Building Habits That Actually Stick (Using a Digital Habit Tracker)
Common Questions About CrossFit Gym Revenue
How much does the average CrossFit gym actually make?
Average CrossFit affiliates gross $150K-$350K/year, but owner take-home is typically $40K-$80K in years one and two. The gross number is easy to find. The take-home number — after rent, payroll, equipment, and honest accounting for owner hours — is what the calculator above helps you pin down for your specific situation.
What’s the biggest mistake most box owners make?
Obsessing over member count and ignoring monthly churn. A gym with 120 members and 5% churn is losing 6 members/month — that’s a full-time sales job just to stay flat. Drop churn to 2% and you free up 10-15 hours a week that used to go to recruiting. Retention is always cheaper than acquisition.
How long before a CrossFit gym turns a real profit?
Most boxes that make it take 18-24 months to hit steady-state profitability — defined as the owner paying themselves a market-rate wage and still having net income left over. The ones that fail usually fail in months 14-20 when the initial founding-member cohort starts churning and replacement sign-ups haven’t caught up.
Do I need special tools or software?
You need a gym management platform for billing and class scheduling (Wodify, PushPress, or Kilo are the big three). For financial modeling, our free calculators and trackers at Digital Dashboard Hub cover revenue forecasting, break-even analysis, and scenario planning before you need anything more expensive.
Keep reading (related guides):
14-day trial · Stripe checkout · Cancel anytime
What Most People Get Wrong
The single biggest mistake is treating revenue as the headline number. Revenue is vanity — margin is sanity, and cash-in-bank is reality. Two operators with identical top-lines routinely end the year $80K apart in take-home, because one priced for volume and the other priced for sustainability. The calculator above forces you to surface that gap before it hits your bank account.
The second mistake is modeling a “best case” and planning around it. The number you should plan around is the 30th-percentile scenario — enough demand to matter, but slower than you hoped. If the business still covers your living expenses there, you have real margin of safety. If it only works in the 80th-percentile case, you are building on sand.
The third mistake is ignoring your time as a cost. If you would otherwise earn $55/hr at a day job and this operation pays you effectively $18/hr for 60-hour weeks, the gap is the real price of running it. Plug your opportunity cost into the calculator and the picture often flips.
How to Pressure-Test Your Numbers
Start with the calculator, then stress-test three levers independently:
- Pricing: What happens to your take-home if you raise prices 10%, but lose 15% of volume? Most operators are surprised to find net income goes up.
- Costs: What happens if your largest input cost rises 20%? This is not hypothetical — it is a typical 12-month swing in most industries.
- Volume: What happens at 70% of your planned volume for 90 days? If that still covers fixed costs, you have a real business. If not, the model is fragile.
Running the calculator three ways takes about ten minutes. The clarity on the other side of those ten minutes is usually the difference between a confident operating plan and guessing for another six months.
Frequently Asked Questions
How accurate is this calculator?
The underlying math uses industry-standard margin and cost ranges sourced from the How Much Does a CrossFit Gym Make? space. Your actual numbers depend on location, seasonality, and operating style, so treat this as a directional benchmark, not a guarantee. The more precisely you enter your inputs, the tighter the output range becomes.
Can I save my results?
A free Digital Dashboard Hub account saves every scenario you run, lets you compare side-by-side, and unlocks the full dashboard with expense tracking and month-over-month charts. The 14-day trial includes the complete tool library — no credit card required to start.
Who is this tool for?
It’s built for anyone pressure-testing a real decision — existing operators auditing their margins, side-hustlers deciding whether to go full-time, and prospective owners trying to sanity-check a business plan before signing a lease. You do not need any accounting background to use it.
What should I do with the results?
Start by comparing the output against your current (or projected) monthly take-home. If the gap is big, walk back the inputs and identify which lever — pricing, volume, or cost structure — is doing the damage. That is usually where the highest-leverage fix lives.
The Bottom Line
Most operators lose money not because the math is impossible, but because they never actually ran it. Fifteen minutes with the calculator beats three months of guessing. Run your numbers, screenshot the output, and use it as the baseline for every pricing and cost decision over the next quarter.
When you are ready to go deeper, the full Digital Dashboard Hub workspace lets you save scenarios, track actuals month-over-month, and see the trend before problems compound. That is the version that actually compounds the effort — spreadsheets forgotten in a Google Drive folder do not.
Next Steps
- Run the calculator above with your best current estimates.
- Re-run it with a pessimistic scenario (lower volume, higher costs) and a stretch scenario (better pricing, more efficient ops).
- Screenshot all three outputs so you have a baseline to compare against when reality arrives.
- Revisit monthly — the number that matters is the one that changes with your real P&L.
Ready for the full dashboard?
Unlock all 255 tools across business, creator, and health workflows.
Andy Gaber is the founder of Digital Dashboard Hub, a suite of 255+ interactive financial, productivity, and wellness tools. He built DDH after getting frustrated with financial apps that gave outputs without context. Follow along for tool tutorials, revenue analytics breakdowns, and honest takes on personal finance.