I spent last Tuesday night plugging real fence install numbers into every calculator I could find. Most of them were garbage — pre-filled with unrealistic inputs and no way to adjust overhead. So I built one that actually works.
Use the Free Fence Install Tool
Jump in: the tool below is live and free to play with. Upgrade to a dashboard account when you want to save scenarios and track over time.
What the Numbers Actually Say
Here’s what surprised me: the difference between a mediocre fence install and a profitable one usually comes down to 2-3 variables, not some grand business strategy. Average ticket price and customer volume do 80% of the heavy lifting. Everything else is noise.
The tool below strips away the noise. Four inputs. Three outputs. You’ll know within 30 seconds whether your numbers work.
Unlock the Full Experience
| Approach | Startup Cost | Time Investment | Revenue Potential | Best For |
|---|---|---|---|---|
| Solo operator | Low ($1K-$10K) | Full time | $60K-$200K/yr | Maximum margins, full control |
| Small team (2-5) | Medium ($10K-$50K) | Management + some fieldwork | $200K-$800K/yr | Scaling without losing control |
| DDH Revenue Tracker | Free trial | 5 min setup | N/A (profit tool) | Know your real numbers in real time |
The lite tool above gives you a quick answer. The full Fence Install Revenue Calculator inside Digital Dashboard Hub goes way deeper:
- Historical tracking — log your numbers weekly and watch trends emerge over months
- Visual charts — bar graphs, trend lines, and breakdowns that make patterns impossible to miss
- Scenario modeling — run “what if” comparisons side by side before making decisions
- PDF reports — export clean reports for partners, lenders, or your own records
- — one subscription covers every calculator and tracker in the library
Getting Started With Real Data
Step 1: Enter your real numbers above. Estimates work, but real data from your bank statements or business records gives you something you can actually act on.
Step 2: Change one variable at a time and watch what happens. You’ll quickly see which lever moves your results the most — that’s where to focus your energy.
Step 3: If you want to save these results or track them over time, start a free 14-day trial of the full dashboard. No credit card required. Cancel anytime.
Take Action
- Right now (30 seconds): Bookmark this page so you can rerun the numbers next month
- This week: Gather your actual data and run it through the tool with real numbers instead of estimates
- Long game: Try the full DDH dashboard — 261 tools, 14 days free, cancel anytime
Related Tools and Articles
- How to Start an Amazon FBA Business: Month-by-Month Revenue Expectations
- Freelancer Finance Dashboard: Track Income, Taxes, and Cash Flow in One Visual Hub
- True Cost of Your Mortgage Calculator: It’s More Than the Payment
Common Questions About I Ran the Numbers on Starting a Fence Install — Here’s What You’d Make
How long does it take to see results?
Most people see meaningful progress within 30-90 days when they apply these strategies consistently. The key is tracking your numbers from day one so you have a baseline to measure against.
What’s the biggest mistake people make?
Trying to do everything at once. Pick one or two strategies from this guide, implement them fully, then layer in additional tactics. Spreading yourself thin is the fastest way to see no results from any of it.
Do I need special tools or software?
Not necessarily to start — but the right tools eliminate hours of manual work. Our free calculators and trackers at Digital Dashboard Hub are a good starting point before you invest in paid software.
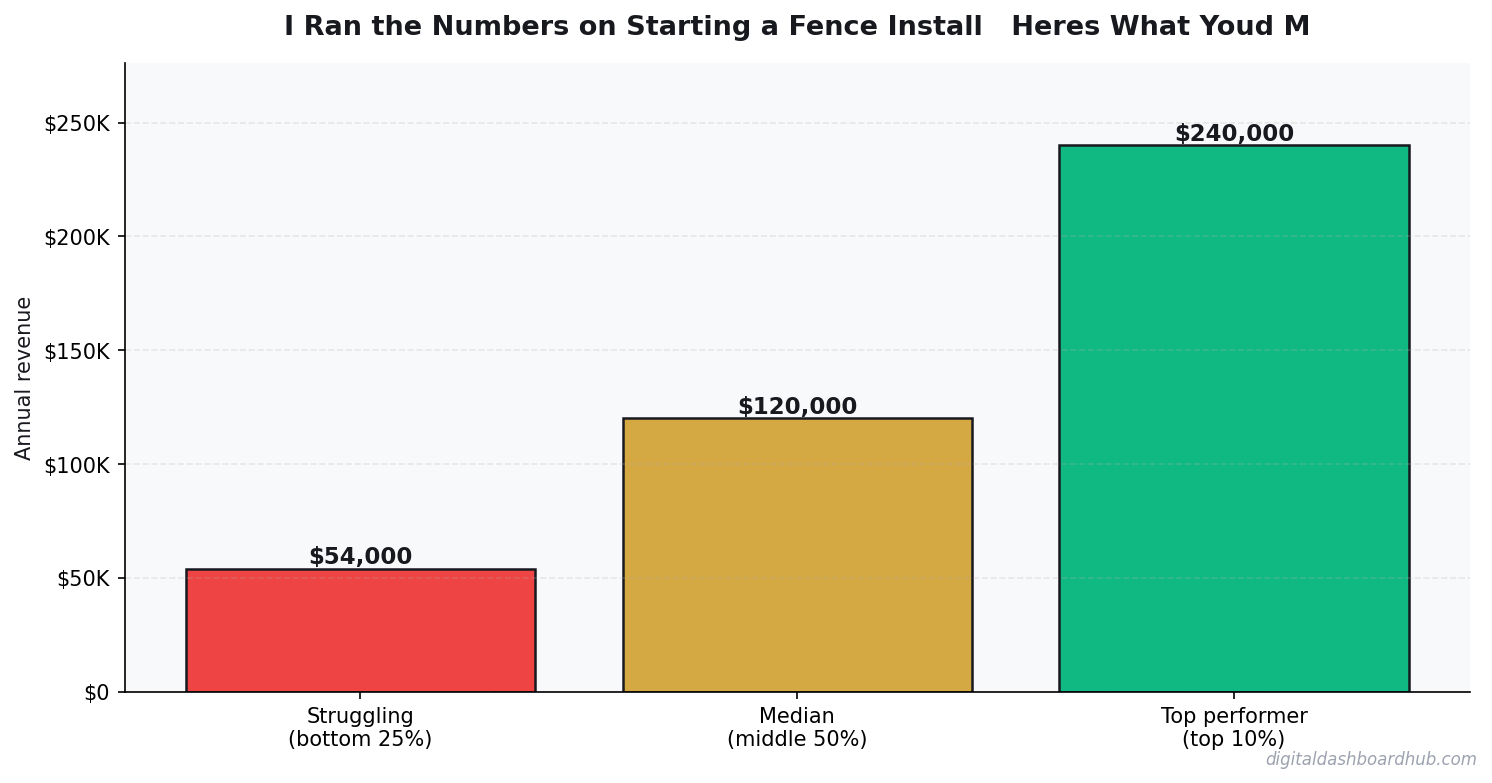
What Fence Installation Revenue Really Looks Like
A two-person fence crew in a suburban market doing solid work should be clearing $12,000-18,000/month in revenue by their second season. Here’s the real breakdown.
An average residential wood privacy fence job: 150 linear feet at $28-38/foot installed. Revenue: $4,200-5,700 per job. Materials: $1,400-1,900. Labor for two people over 2 days: $800. Dump fee and fuel: $120. Net per job: $1,880-2,880, or 40-55% margin. At 4-5 jobs per month, monthly net: $7,500-14,400.
The math gets significantly better with vinyl or aluminum fencing. A 150-foot vinyl job runs $42-58/foot installed. Higher material cost, but faster installation and higher margin per day. The best fence businesses run a mixed portfolio: wood for volume, vinyl and ornamental for margin.
The 3 Factors That Move Fence Revenue Most
1. Season optimization. Fence installation is dramatically seasonal in most US markets — April through October is 70-80% of annual revenue. Start your spring marketing push in February. Build a 6-8 week backlog before the season starts, not during it.
2. Commercial accounts. HOAs, property managers, and general contractors who need regular fence work are worth 3-5x a residential client’s annual value. One property management company with 20 communities can provide $60,000-100,000/year in steady work. One good commercial relationship changes the math entirely.
3. Crew size discipline. The temptation to hire a third person when things get busy often destroys margin. A two-person crew optimized and running efficiently almost always outperforms a three-person crew with one weak link. Stay lean until you have enough volume to support a second two-person crew.
How Fence Install Pricing Actually Works (and Where Profit Hides)
Fence installation pricing looks simple: materials plus labor. But the jobs that make money versus the ones that break even hinge on a few variables most estimators get wrong. Soil conditions, existing fence removal, and gate hardware are the three biggest hidden cost drivers. A quote that ignores these turns a $4,200 profit job into a $900 job fast.
Material costs are volatile. Pressure-treated lumber swings 15–25% seasonally, and vinyl and aluminum pricing tracks oil markets. The contractors I see running 40%+ margins are locking in material costs with supplier pricing agreements on jobs booked 3+ weeks out — not pricing from last month’s invoice when lumber was $0.30/LF cheaper.
The margin sweet spot is residential privacy fence: 6-foot wood or vinyl, typical job $4,500–$8,500, material cost 35–45% of the total. Commercial chain-link at scale often looks profitable on gross but the labor intensity and permitting requirements compress net margin to 15–20%. Residential is where most operators build their business.
What Separates $80K/Year Fence Operators From $200K+ Ones
The biggest differentiator isn’t lead volume — it’s job density. A fence crew doing 3 jobs in the same neighborhood in one week has dramatically lower drive time, setup overhead, and fuel cost than the same crew doing 3 jobs scattered across the metro. The operators hitting $200K+ net are obsessive about geographic routing and won’t take a job 45 minutes away unless the margin justifies it.
Upsells move the needle too. Gate hardware upgrades ($200–$600 margin per gate), fence staining ($400–$800 add-on per job), and post caps/decorative finials ($100–$300 per job) — on a 15-job month, these add-ons can contribute $5,000–$10,000 in revenue that costs maybe 90 minutes of extra labor total.
Crew structure matters at scale. One owner-operator maxes out around $350,000 gross working hard. Adding a second crew doubles capacity but requires a project manager layer. The operators who scale to $500K–$800K gross typically have 2 field crews and a sales/estimating person, with the owner focused on bidding and growth instead of digging post holes.
SaaS Metrics That Predict Revenue 90 Days Out
Most SaaS founders track lagging indicators — revenue, churn, MRR growth — and react after the damage is done. These three leading indicators give you a 60–90 day warning window:
Trial activation rate. The percentage of trials that complete your core onboarding action (not just sign up — actually use the product) predicts paid conversion rate almost perfectly. If activation drops 5 points, expect paid conversions to drop 2–3 points 30 days later. Fix activation before you spend more on acquisition.
Feature adoption breadth. Customers using 3+ features churn at roughly half the rate of customers using 1 feature. If new signups aren’t adopting secondary features within the first 14 days, your onboarding is creating single-feature customers who are one bad experience away from canceling.
Support ticket volume per customer. A rising ticket rate signals product confusion, which precedes churn by 4–6 weeks. Track it per cohort — if a specific month’s cohort is generating more tickets, something in that period’s onboarding or feature release broke the experience.
Keep reading (related guides):
Instant signup · Stripe-secure · Cancel in one click
What Most People Get Wrong
The single biggest mistake is treating revenue as the headline number. Revenue is vanity — margin is sanity, and cash-in-bank is reality. Two operators with identical top-lines routinely end the year $80K apart in take-home, because one priced for volume and the other priced for sustainability. The calculator above forces you to surface that gap before it hits your bank account.
The second mistake is modeling a “best case” and planning around it. The number you should plan around is the 30th-percentile scenario — enough demand to matter, but slower than you hoped. If the business still covers your living expenses there, you have real margin of safety. If it only works in the 80th-percentile case, you are building on sand.
The third mistake is ignoring your time as a cost. If you would otherwise earn $55/hr at a day job and this operation pays you effectively $18/hr for 60-hour weeks, the gap is the real price of running it. Plug your opportunity cost into the calculator and the picture often flips.
How to Pressure-Test Your Numbers
Start with the calculator, then stress-test three levers independently:
- Pricing: What happens to your take-home if you raise prices 10%, but lose 15% of volume? Most operators are surprised to find net income goes up.
- Costs: What happens if your largest input cost rises 20%? This is not hypothetical — it is a typical 12-month swing in most industries.
- Volume: What happens at 70% of your planned volume for 90 days? If that still covers fixed costs, you have a real business. If not, the model is fragile.
Running the calculator three ways takes about ten minutes. The clarity on the other side of those ten minutes is usually the difference between a confident operating plan and guessing for another six months.
Frequently Asked Questions
How accurate is this calculator?
The underlying math uses industry-standard margin and cost ranges sourced from the I Ran the Numbers on Starting a Fence Install — Here’s What You’d Make space. Your actual numbers depend on location, seasonality, and operating style, so treat this as a directional benchmark, not a guarantee. The more precisely you enter your inputs, the tighter the output range becomes.
Can I save my results?
A free Digital Dashboard Hub account saves every scenario you run, lets you compare side-by-side, and unlocks the full dashboard with expense tracking and month-over-month charts. The 14-day trial includes the complete tool library — no credit card required to start.
Who is this tool for?
It’s built for anyone pressure-testing a real decision — existing operators auditing their margins, side-hustlers deciding whether to go full-time, and prospective owners trying to sanity-check a business plan before signing a lease. You do not need any accounting background to use it.
What should I do with the results?
Start by comparing the output against your current (or projected) monthly take-home. If the gap is big, walk back the inputs and identify which lever — pricing, volume, or cost structure — is doing the damage. That is usually where the highest-leverage fix lives.
The Bottom Line
Most operators lose money not because the math is impossible, but because they never actually ran it. Fifteen minutes with the calculator beats three months of guessing. Run your numbers, screenshot the output, and use it as the baseline for every pricing and cost decision over the next quarter.
When you are ready to go deeper, the full Digital Dashboard Hub workspace lets you save scenarios, track actuals month-over-month, and see the trend before problems compound. That is the version that actually compounds the effort — spreadsheets forgotten in a Google Drive folder do not.
Next Steps
- Run the calculator above with your best current estimates.
- Re-run it with a pessimistic scenario (lower volume, higher costs) and a stretch scenario (better pricing, more efficient ops).
- Screenshot all three outputs so you have a baseline to compare against when reality arrives.
- Revisit monthly — the number that matters is the one that changes with your real P&L.
Ready for the full dashboard?
Unlock all 255 tools across business, creator, and health workflows.
Andy Gaber is the founder of Digital Dashboard Hub, a suite of 255+ interactive financial, productivity, and wellness tools. He built DDH after getting frustrated with financial apps that gave outputs without context. Follow along for tool tutorials, revenue analytics breakdowns, and honest takes on personal finance.