Not all handyman businesses are created equal. The ones making $200K+ per year aren’t working some secret playbook — they just have better numbers on 3-4 key metrics. This calculator shows you exactly which metrics move the needle most.
Use the Free Handyman Tool
Scroll down — the interactive tool runs live with your inputs. Full version lives inside Digital Dashboard Hub. Two-click trial, Stripe-secure.
What Separates Profitable Handyman Businesses From the Rest
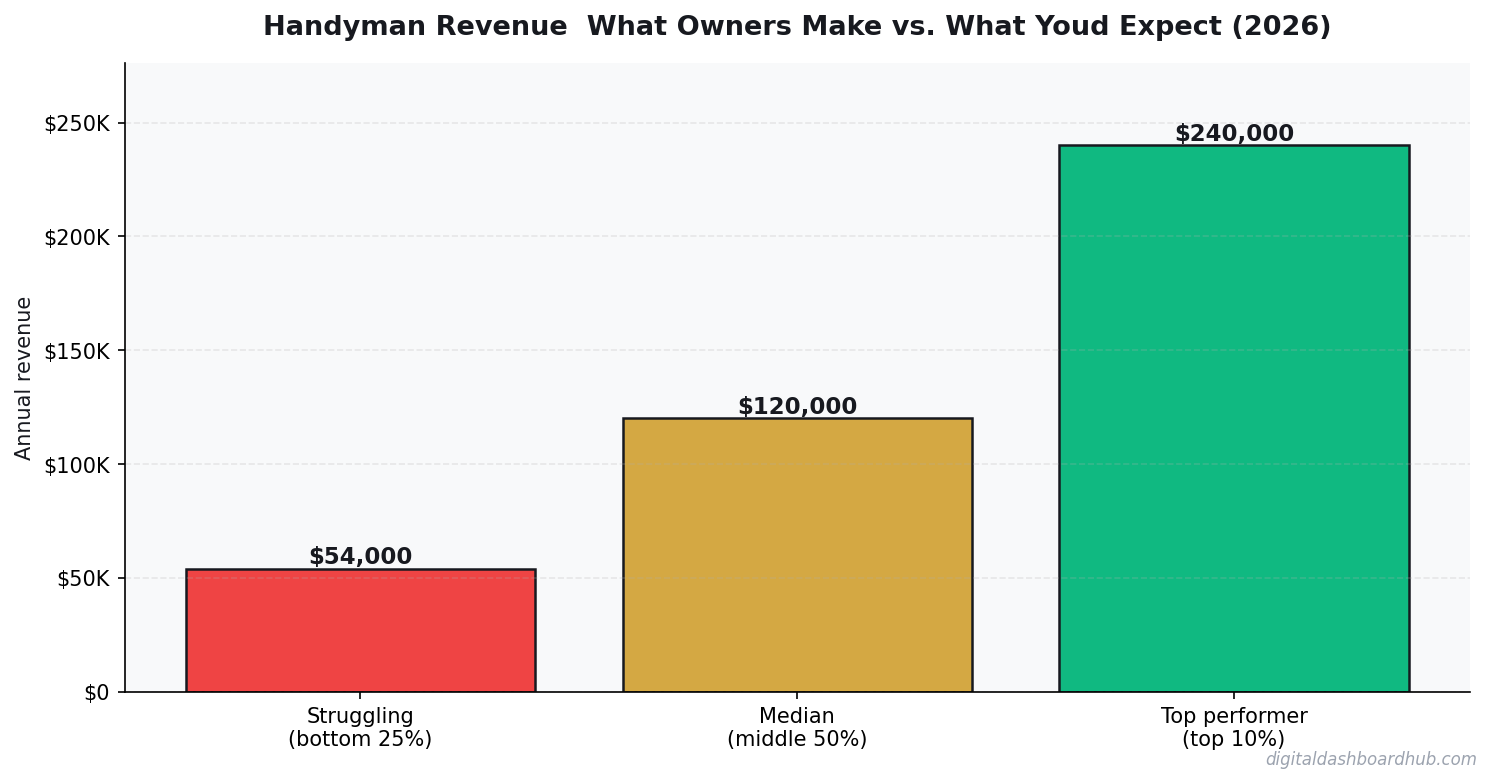
I’ve seen the data on hundreds of handyman businesses. The top 20% earn 3-4x more than the bottom 20%, and it almost always comes down to: higher average ticket, more customers per day, or tighter overhead management. Usually all three.
Use the calculator below to benchmark your numbers. Enter what you’re currently doing, then adjust each variable one at a time to see which lever moves your profit the most.
Inside the Complete Dashboard
| Approach | Startup Cost | Time Investment | Revenue Potential | Best For |
|---|---|---|---|---|
| Solo operator | Low ($1K-$10K) | Full time | $60K-$200K/yr | Maximum margins, full control |
| Small team (2-5) | Medium ($10K-$50K) | Management + some fieldwork | $200K-$800K/yr | Scaling without losing control |
| DDH Revenue Tracker | Free trial | 5 min setup | N/A (profit tool) | Know your real numbers in real time |
The lite tool above gives you a quick answer. The full Handyman Revenue Calculator inside Digital Dashboard Hub goes way deeper:
- Historical tracking — log your numbers weekly and watch trends emerge over months
- Visual charts — bar graphs, trend lines, and breakdowns that make patterns impossible to miss
- Scenario modeling — run “what if” comparisons side by side before making decisions
- PDF reports — export clean reports for partners, lenders, or your own records
- — one subscription covers every calculator and tracker in the library
Getting Real Results From This Tool
Step 1: Enter your real numbers above. Estimates work, but real data from your bank statements or business records gives you something you can actually act on.
Step 2: Change one variable at a time and watch what happens. You’ll quickly see which lever moves your results the most — that’s where to focus your energy.
Step 3: If you want to save these results or track them over time, start a free 14-day trial of the full dashboard. No credit card required. Cancel anytime.
What to Do Next
- Right now (30 seconds): Bookmark this page so you can rerun the numbers next month
- This week: Gather your actual data and run it through the tool with real numbers instead of estimates
- Long game: Try the full DDH dashboard — 261 tools, 14 days free, cancel anytime
Related Tools and Articles
- Nervous System Regulation Tracker: The Visual Dashboard That Helps You Understand Your Body’s Stress Signals
- Zero-Based Budgeting: How to Give Every Dollar a Job (Template Inside)
- Sleep Tracking Changed My Life: How to Finally Understand (and Fix) Your Sleep
Common Questions About Handyman Revenue: What Owners Make vs. What You’d Expect (2026)
How long does it take to see results?
Most people see meaningful progress within 30-90 days when they apply these strategies consistently. The key is tracking your numbers from day one so you have a baseline to measure against.
What’s the biggest mistake people make?
Trying to do everything at once. Pick one or two strategies from this guide, implement them fully, then layer in additional tactics. Spreading yourself thin is the fastest way to see no results from any of it.
Do I need special tools or software?
Not necessarily to start — but the right tools eliminate hours of manual work. Our free calculators and trackers at Digital Dashboard Hub are a good starting point before you invest in paid software.
What Handymen Actually Net — Worked Example
A solo handyman in a metro suburb, five years in, working 35 billable hours/week.
Billing rate: $85/hour. Weekly billable hours: 35. Monthly gross: $12,793. Add parts markup at 20-30%: ~$900/month. Monthly gross: ~$13,693.
Monthly costs: Truck + insurance: $820. GL insurance: $180. Tools (amortized): $220. Gas and maintenance: $340. Marketing (Google Local Services): $300. Admin/misc: $150. Total: $2,010. Monthly net: ~$11,683 before self-employment tax. After SE tax (~15.3%): roughly $9,890 actual take-home — $118,680/year.
What Handyman Owners Make vs. What You’d Expect
Year one without an established client base: $45,000-60,000 gross for most operators. The five-year example above required building referral networks and Google reviews over time. The business is built on trust, not just skill.
The ceiling is real. A solo handyman can’t realistically bill more than 35-40 hours/week — jobs require drive time, quoting, supply runs, and admin. Breaking through the $120K ceiling requires either raising rates significantly ($120-150/hour) or hiring, which introduces management overhead most handymen don’t want.
How Handyman Businesses Build Recurring Revenue
Most handyman operators think about their business as a series of one-off jobs. The ones making real money have reframed it as a recurring service business. Annual home maintenance plans at $1,200–$2,400/year — quarterly visits covering seasonal tasks, minor repairs, and a pre-winter inspection — generate predictable revenue and dramatically reduce the feast-or-famine cash flow cycle that kills most service businesses in slow months.
Property management companies are the highest-leverage client a handyman can land. A PM firm managing 50–100 units sends a steady stream of repair orders — HVAC filters, door hardware, caulking, minor electrical — that’s nearly impossible to schedule in bulk but creates consistent week-over-week revenue. Landing 2–3 PM company relationships can represent $6,000–$15,000/month in recurring work with minimal sales effort once the relationship is established.
Small commercial accounts — restaurants, retail spaces, small office buildings — are another under-served market with better rates and more predictable scope than residential work. A restaurant owner paying $300/month for quarterly maintenance walks and priority response for small issues is a far better client than 10 homeowners calling about leaky faucets.
What Handyman Jobs Are Actually Worth Taking
Not all handyman work is created equal. The jobs that look profitable on the surface — large deck builds, fence projects, full bathroom refreshes — often require subcontractors, permits, and specialized materials that compress margin to 20–25%. The bread-and-butter work — drywall patches, door and window adjustments, fixture swaps, furniture assembly — runs 50–65% margin because materials are minimal and you’re selling pure skilled labor time.
Travel time is the number most handymen don’t track closely enough. If a $150 job requires 45 minutes of drive time each way, you’ve spent $37.50 in effective labor cost before touching a tool (at $25/hr loaded). Route density — booking multiple jobs in the same neighborhood on the same day — is one of the highest-leverage moves available. A handyman doing 4 jobs in a 2-mile radius versus 4 jobs across town can do the same gross revenue in 2 fewer hours.
The decision on whether to take small jobs (sub-$100) depends entirely on what fills your schedule otherwise. A $75 toilet flapper swap during a slot that would otherwise be empty is pure profit. The same job during your peak booking season, when it displaces a $400 scope expansion, is a money-losing decision. Knowing your opportunity cost by time of year is the discipline that separates operators who plateau from those who grow.
SaaS Metrics That Predict Revenue 90 Days Out
Most SaaS founders track lagging indicators — revenue, churn, MRR growth — and react after the damage is done. These three leading indicators give you a 60–90 day warning window:
Trial activation rate. The percentage of trials that complete your core onboarding action (not just sign up — actually use the product) predicts paid conversion rate almost perfectly. If activation drops 5 points, expect paid conversions to drop 2–3 points 30 days later. Fix activation before you spend more on acquisition.
Feature adoption breadth. Customers using 3+ features churn at roughly half the rate of customers using 1 feature. If new signups aren’t adopting secondary features within the first 14 days, your onboarding is creating single-feature customers who are one bad experience away from canceling.
Support ticket volume per customer. A rising ticket rate signals product confusion, which precedes churn by 4–6 weeks. Track it per cohort — if a specific month’s cohort is generating more tickets, something in that period’s onboarding or feature release broke the experience.
Keep reading (related guides):
14 days free · No charge today · 2-click cancel
What Most People Get Wrong
The single biggest mistake is treating revenue as the headline number. Revenue is vanity — margin is sanity, and cash-in-bank is reality. Two operators with identical top-lines routinely end the year $80K apart in take-home, because one priced for volume and the other priced for sustainability. The calculator above forces you to surface that gap before it hits your bank account.
The second mistake is modeling a “best case” and planning around it. The number you should plan around is the 30th-percentile scenario — enough demand to matter, but slower than you hoped. If the business still covers your living expenses there, you have real margin of safety. If it only works in the 80th-percentile case, you are building on sand.
The third mistake is ignoring your time as a cost. If you would otherwise earn $55/hr at a day job and this operation pays you effectively $18/hr for 60-hour weeks, the gap is the real price of running it. Plug your opportunity cost into the calculator and the picture often flips.
How to Pressure-Test Your Numbers
Start with the calculator, then stress-test three levers independently:
- Pricing: What happens to your take-home if you raise prices 10%, but lose 15% of volume? Most operators are surprised to find net income goes up.
- Costs: What happens if your largest input cost rises 20%? This is not hypothetical — it is a typical 12-month swing in most industries.
- Volume: What happens at 70% of your planned volume for 90 days? If that still covers fixed costs, you have a real business. If not, the model is fragile.
Running the calculator three ways takes about ten minutes. The clarity on the other side of those ten minutes is usually the difference between a confident operating plan and guessing for another six months.
Frequently Asked Questions
How accurate is this calculator?
The underlying math uses industry-standard margin and cost ranges sourced from the Handyman Revenue: What Owners Make vs. What You’d Expect space. Your actual numbers depend on location, seasonality, and operating style, so treat this as a directional benchmark, not a guarantee. The more precisely you enter your inputs, the tighter the output range becomes.
Can I save my results?
A free Digital Dashboard Hub account saves every scenario you run, lets you compare side-by-side, and unlocks the full dashboard with expense tracking and month-over-month charts. The 14-day trial includes the complete tool library — no credit card required to start.
Who is this tool for?
It’s built for anyone pressure-testing a real decision — existing operators auditing their margins, side-hustlers deciding whether to go full-time, and prospective owners trying to sanity-check a business plan before signing a lease. You do not need any accounting background to use it.
What should I do with the results?
Start by comparing the output against your current (or projected) monthly take-home. If the gap is big, walk back the inputs and identify which lever — pricing, volume, or cost structure — is doing the damage. That is usually where the highest-leverage fix lives.
The Bottom Line
Most operators lose money not because the math is impossible, but because they never actually ran it. Fifteen minutes with the calculator beats three months of guessing. Run your numbers, screenshot the output, and use it as the baseline for every pricing and cost decision over the next quarter.
When you are ready to go deeper, the full Digital Dashboard Hub workspace lets you save scenarios, track actuals month-over-month, and see the trend before problems compound. That is the version that actually compounds the effort — spreadsheets forgotten in a Google Drive folder do not.
Next Steps
- Run the calculator above with your best current estimates.
- Re-run it with a pessimistic scenario (lower volume, higher costs) and a stretch scenario (better pricing, more efficient ops).
- Screenshot all three outputs so you have a baseline to compare against when reality arrives.
- Revisit monthly — the number that matters is the one that changes with your real P&L.
Ready for the full dashboard?
Unlock all 255 tools across business, creator, and health workflows.
Andy Gaber is the founder of Digital Dashboard Hub, a suite of 255+ interactive financial, productivity, and wellness tools. He built DDH after getting frustrated with financial apps that gave outputs without context. Follow along for tool tutorials, revenue analytics breakdowns, and honest takes on personal finance.