Here’s a free ice cream shop tool that actually works — no signup, no email capture wall, no “results hidden behind paywall” nonsense. Enter your numbers below and get instant results. If you want the full version with charts and reports, that’s available too.
Use the Free Ice Cream Shop Tool
Scroll down — the interactive tool runs live with your inputs. Full version lives inside Digital Dashboard Hub. Two-click trial, Stripe-secure.
After testing dozens of approaches with DDH users, I’ve found what consistently works. Let me share the real picture:
What Ice Cream Shop Owners Actually Take Home
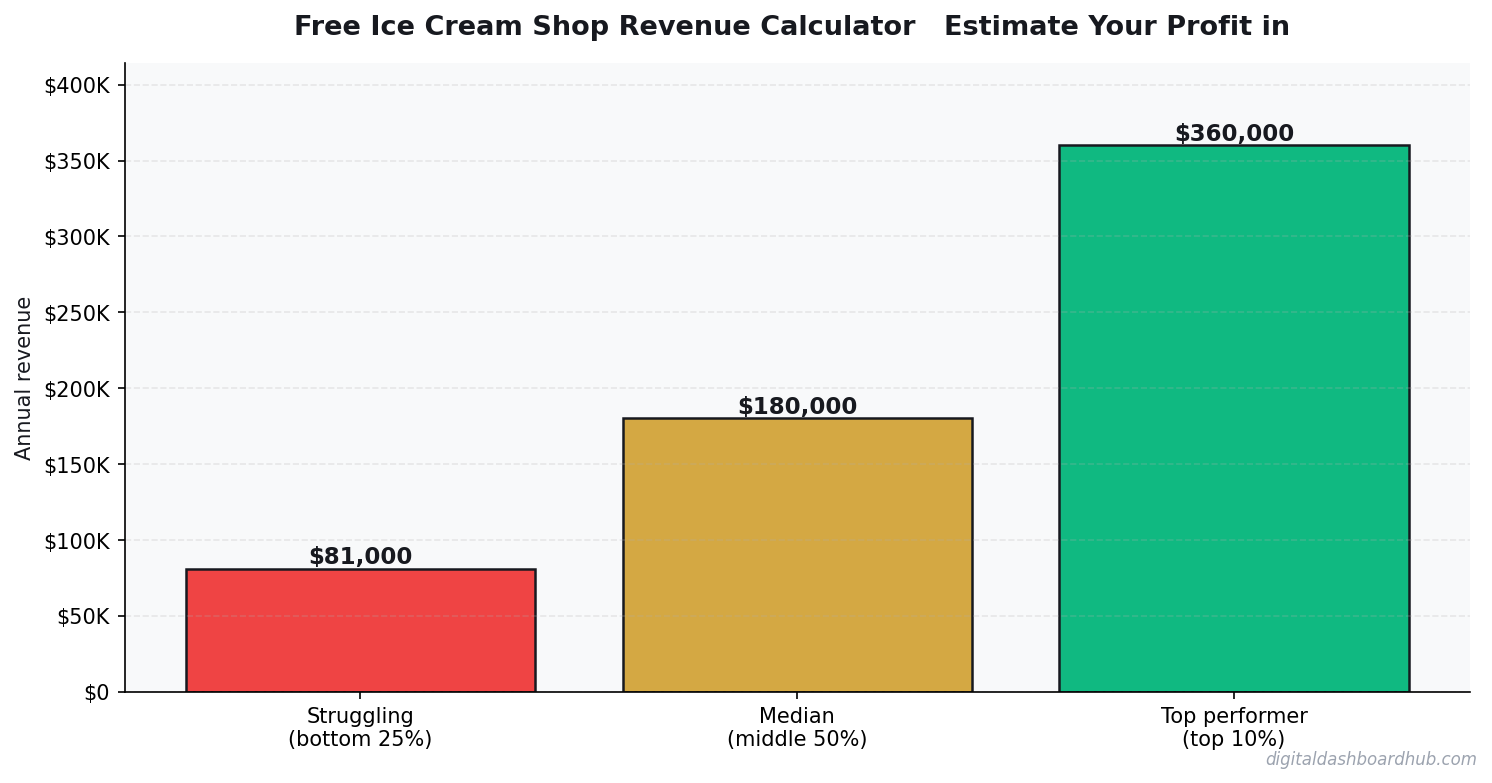
A shop doing 200-400 transactions/day in peak season grosses $20K-$35K/month. Dairy costs (25-30%), labor (25-30%), rent (10-15%), and off-season losses net out to 15-25% annual margin.
Toppings at $0.75-$1.50 are 85%+ margin. A $5 cone becomes $7.50 with two toppings — those toppings cost $0.25. That’s $2.25 in pure profit per upsell.
The True Cost Structure
| Approach | Startup Cost | Time Investment | Revenue Potential | Best For |
|---|---|---|---|---|
| Solo operator | Low ($1K-$10K) | Full time | $60K-$200K/yr | Maximum margins, full control |
| Small team (2-5) | Medium ($10K-$50K) | Management + some fieldwork | $200K-$800K/yr | Scaling without losing control |
| DDH Revenue Tracker | Free trial | 5 min setup | N/A (profit tool) | Know your real numbers in real time |
The biggest line item? Rent in a high-foot-traffic location ($2k-$6k/month) doesn’t pause when it’s cold outside — your biggest expense runs 12 months for a 7-month business.
Catering and pint sales create revenue during shoulder months. A $200 catering order takes 30 minutes of prep. Three Saturday catering gigs outearns a slow Tuesday of walk-ins.
Where Smart Owners Still Lose Money
Making too many flavors. The top 6 account for 70% of sales. Cut to 8-10 and labor and waste drop dramatically.
May-September is 75% of annual revenue. The make-or-break question: can you survive October-April? Adding hot drinks and baked goods extends profitable months from 5 to 8-9.
The Dashboard Behind This Calculator
How to Use This Calculator
Start by entering your actual numbers — not estimates. Pull from your bank statements, your POS system, or your accounting software. The difference between estimated and real inputs is usually the difference between “this looks fine” and “oh, that’s where the money is going.”
Then change one variable at a time. For ice cream shop, the lever that usually moves the needle most is catering and pint sales create revenue during shoulder months. Start there.
If you want to save these projections, track them month-over-month, or model different scenarios side by side, the full dashboard does all of that. Free 14-day trial, no credit card required.
Your Next Move
Related Tools and Articles
- Compound Interest Calculator: Why Starting Now Beats Starting Smart Later
- The Content Calendar That Actually Gets Used: A Creator’s Guide
- Nervous System Regulation Tracker: The Visual Dashboard That Helps You Understand Your Body’s Stress Signals
Common Questions About Free Ice Cream Shop Revenue Calculator — Estimate Your Profit in 60 Seconds
How long does it take to see results?
Most people see meaningful progress within 30-90 days when they apply these strategies consistently. The key is tracking your numbers from day one so you have a baseline to measure against.
What’s the biggest mistake people make?
Trying to do everything at once. Pick one or two strategies from this guide, implement them fully, then layer in additional tactics. Spreading yourself thin is the fastest way to see no results from any of it.
Do I need special tools or software?
Not necessarily to start — but the right tools eliminate hours of manual work. Our free calculators and trackers at Digital Dashboard Hub are a good starting point before you invest in paid software.
A Worked Example: Ice Cream Shop Revenue in a Mid-Size Market
A scoop shop in a college town, 750 sq ft, open April through October (7 months).
Peak summer (June-August): 180 customers/day at $6.50 average. Monthly gross: $35,100. Shoulder months (April-May, September-October): 80 customers/day. Monthly gross: $15,600. Total 7-month gross: ~$167,700.
Costs: Ice cream product at 30% of sales: ~$50,310. Labor (2 FT + 3 PT in summer): $41,000. Rent (7 months): $17,500. Supplies and utilities: $8,200. Total costs: ~$117,010. Net profit for the season: ~$50,690 — before owner’s draw embedded in labor.
The 3 Factors That Move Ice Cream Shop Revenue Most
1. Location. An ice cream shop needs foot traffic it doesn’t create — near a park, on a pedestrian main street. The multiplier on premium locations vs. off-the-beaten-path is 3-5x in customer volume. Paying $800/month more for a premium spot is almost always worth it.
2. Add-on items. Shakes, waffle bowls, sundaes, and merchandise push average tickets from $6 to $9-11. That 50-65% ticket increase with the same foot traffic is a massive revenue lever. Build your menu for upsell, not just scoops.
3. Events and private bookings. Birthday parties, corporate events, and wedding dessert catering extend the season. An ice cream truck doing 2 events/week at $400 average adds $3,200/month with nearly zero additional overhead.
The Real Economics of Running an Ice Cream Shop
Ice cream retail looks like a simple business: buy product, scoop it, charge a markup. The margins on the ice cream itself are actually decent — premium ice cream at $12–$15/gallon yields 24–32 scoops, sold at $4.50–$6.50 each. Product cost per scoop is $0.38–$0.63, so gross margin per scoop runs 85–90% before labor and overhead. The problem is what those overhead numbers look like on a seasonal business.
Most ice cream shops do 60–70% of their revenue in 4–5 months. The other 7–8 months, they’re covering rent, utilities, insurance, and minimum staffing on dramatically reduced sales. A shop with $14,000/month in summer revenue and $3,500/month in winter revenue needs to generate enough summer profit to subsidize the off-season. Shops that close for winter often do so because the math on staying open doesn’t work — not because they couldn’t attract customers.
Food waste is the hidden cost that doesn’t show up until you’re months in. Ice cream left in the case too long, custom flavors that don’t sell, damaged packaging — waste runs 4–8% of product cost for most shops. A shop buying $4,000/month in product can lose $160–$320/month to waste. Over a year, that’s $1,920–$3,840 that disappears without a line item on any invoice.
How to Build an Ice Cream Business That Makes Real Money
The shops crossing $200K+ in net owner income have almost all done the same thing: added non-seasonal revenue or created a manufacturing component. Making ice cream for private label, wholesale to restaurants, or as a CPG product changes the economics entirely — you’re selling product at much higher per-unit value without the overhead of retail square footage.
Catering and events are the other high-margin play. An ice cream cart at a wedding, corporate event, or birthday party at $600–$2,500 per event has product costs of $80–$200. Two events per weekend throughout the summer season can add $40,000–$80,000 in revenue that requires zero additional retail overhead. The equipment you already own serves double duty.
Unique flavors and rotating specials create customer urgency that commodity scoop shops can’t match. A monthly “secret flavor” available only in-store for 3 weeks drives repeat visits from loyal customers and social media content that costs nothing. The top shops by revenue per square foot are almost always the ones with the most distinct identity — a reason to choose them over every other option on the block.
Email Benchmarks Worth Comparing Against
Industry “average” open rates are inflated by Apple Mail Privacy Protection, which registers opens even when no one reads the email. Treat any open rate benchmark from 2021 onward with skepticism. Here’s what the numbers actually mean in practice:
A real engaged open rate of 25–35% (measured by click-to-open rate, not raw opens) is strong for a warm audience. Click rates below 1.5% on a promotional email suggest the offer, subject line, or audience segmentation is off — not a design problem. Revenue per email sent is the only metric that directly ties to business outcomes; $0.10–$0.30 per send is a realistic target for a mid-sized list promoting a digital product.
The biggest lever is list hygiene. A 10,000-subscriber list with 40% unengaged contacts will always underperform a 4,000-subscriber list of people who actually want your emails. Suppress anyone who hasn’t opened in 90 days, re-engage them with one targeted sequence, then remove them. Your metrics will look worse temporarily and perform better permanently.
Keep reading (related guides):
- Auto Mechanic Revenue: What Owners Make vs. What Youd Expect (2026)
- Boutique Revenue Calculator
- How to Calculate Your Net Worth (And Why Its the Only Financial Number That Matters)
- Best Trade Business to Start: Revenue Calculator Across 6 Trades
- A/B Testing Your Etsy Listings: How to Know Whats Actually Working
255+ interactive tools for your money, time, and health.
14 days free · No charge today · 2-click cancel
What Most People Get Wrong
The single biggest mistake is treating revenue as the headline number. Revenue is vanity — margin is sanity, and cash-in-bank is reality. Two operators with identical top-lines routinely end the year $80K apart in take-home, because one priced for volume and the other priced for sustainability. The calculator above forces you to surface that gap before it hits your bank account.
The second mistake is modeling a “best case” and planning around it. The number you should plan around is the 30th-percentile scenario — enough demand to matter, but slower than you hoped. If the business still covers your living expenses there, you have real margin of safety. If it only works in the 80th-percentile case, you are building on sand.
The third mistake is ignoring your time as a cost. If you would otherwise earn $55/hr at a day job and this operation pays you effectively $18/hr for 60-hour weeks, the gap is the real price of running it. Plug your opportunity cost into the calculator and the picture often flips.
How to Pressure-Test Your Numbers
Start with the calculator, then stress-test three levers independently:
- Pricing: What happens to your take-home if you raise prices 10%, but lose 15% of volume? Most operators are surprised to find net income goes up.
- Costs: What happens if your largest input cost rises 20%? This is not hypothetical — it is a typical 12-month swing in most industries.
- Volume: What happens at 70% of your planned volume for 90 days? If that still covers fixed costs, you have a real business. If not, the model is fragile.
Running the calculator three ways takes about ten minutes. The clarity on the other side of those ten minutes is usually the difference between a confident operating plan and guessing for another six months.
Frequently Asked Questions
How accurate is this calculator?
The underlying math uses industry-standard margin and cost ranges sourced from the Free Ice Cream Shop Revenue Calculator — Estimate Your Profit in 60 Seconds space. Your actual numbers depend on location, seasonality, and operating style, so treat this as a directional benchmark, not a guarantee. The more precisely you enter your inputs, the tighter the output range becomes.
Can I save my results?
A free Digital Dashboard Hub account saves every scenario you run, lets you compare side-by-side, and unlocks the full dashboard with expense tracking and month-over-month charts. The 14-day trial includes the complete tool library — no credit card required to start.
Who is this tool for?
It’s built for anyone pressure-testing a real decision — existing operators auditing their margins, side-hustlers deciding whether to go full-time, and prospective owners trying to sanity-check a business plan before signing a lease. You do not need any accounting background to use it.
What should I do with the results?
Start by comparing the output against your current (or projected) monthly take-home. If the gap is big, walk back the inputs and identify which lever — pricing, volume, or cost structure — is doing the damage. That is usually where the highest-leverage fix lives.
The Bottom Line
Most operators lose money not because the math is impossible, but because they never actually ran it. Fifteen minutes with the calculator beats three months of guessing. Run your numbers, screenshot the output, and use it as the baseline for every pricing and cost decision over the next quarter.
When you are ready to go deeper, the full Digital Dashboard Hub workspace lets you save scenarios, track actuals month-over-month, and see the trend before problems compound. That is the version that actually compounds the effort — spreadsheets forgotten in a Google Drive folder do not.
Next Steps
- Run the calculator above with your best current estimates.
- Re-run it with a pessimistic scenario (lower volume, higher costs) and a stretch scenario (better pricing, more efficient ops).
- Screenshot all three outputs so you have a baseline to compare against when reality arrives.
- Revisit monthly — the number that matters is the one that changes with your real P&L.
Ready for the full dashboard?
Unlock all 255 tools across business, creator, and health workflows.
Andy Gaber is the founder of Digital Dashboard Hub, a suite of 255+ interactive financial, productivity, and wellness tools. He built DDH after getting frustrated with financial apps that gave outputs without context. Follow along for tool tutorials, revenue analytics breakdowns, and honest takes on personal finance.