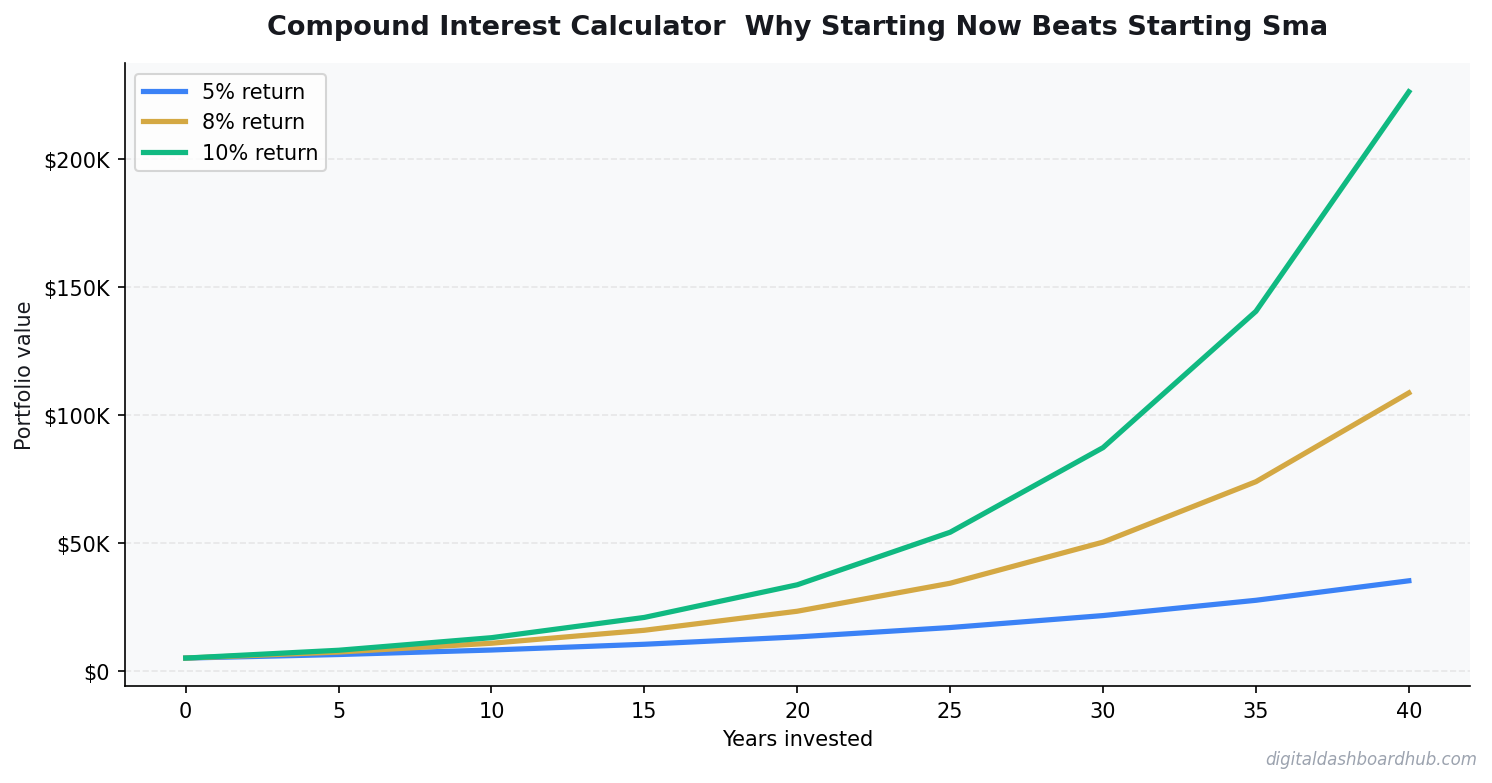
Every month you wait to start investing costs you more money than you’ll make in six months of “optimizing” your portfolio. That’s not hyperbole — it’s what the math actually shows when you run compound interest calculations side by side. Most people are so focused on picking the right investments that they’re ignoring the one variable that matters most: time.
How Compound Interest Actually Works (The Part They Rush Through in School)
Running a SaaS business means I track these numbers obsessively. Here’s what the data actually shows:
Compound interest means you earn returns not just on your original investment, but on your returns too. Your gains generate gains. Over short periods this feels like a rounding error. Over long periods it becomes the dominant force in your portfolio.
The formula: A = P(1 + r/n)^(nt)
- A = final amount
- P = principal (starting amount)
- r = annual interest rate (decimal)
- n = compounding periods per year
- t = time in years
For practical investing purposes with index funds, n = 12 (monthly compounding) and r = 0.07-0.10 depending on how conservative your assumptions are. I use 7% because it’s roughly the historical real return of the US stock market after inflation, and being conservative is smarter than being optimistic.
The Side-by-Side That Changes Everything
| Investor | Monthly Investment | Start Age | End Age | Total Contributed | Final Portfolio (7%) |
|---|---|---|---|---|---|
| Early Emily | $200 | 25 | 65 | $96,000 | $524,000 |
| Later Larry | $500 | 35 | 65 | $180,000 | $567,000 |
| Smart Sam | $500 | 25 | 65 | $240,000 | $1,310,000 |
Emily contributes $84,000 less than Larry and ends up with nearly the same portfolio. Sam contributes $60,000 more than Larry but ends up with over twice as much. The variable driving these outcomes isn’t contribution amount. It’s time.
Every year you delay starting means your money has one fewer compounding cycle. At the end of a 40-year investing horizon, those early cycles are worth exponentially more than the late ones.
Running Your Own Compound Interest Calculation
The variables you need to know:
Starting principal: What you’re investing today (can be $0 — starting from scratch is fine).
Monthly contribution: What you’ll add each month. This is the number most calculators get wrong — they assume it stays flat forever. Real investing means increasing contributions as income grows.
Annual return rate: Use 7% for conservative long-term projections with index funds. Use 10% for historical average including optimistic assumptions. Never use anything above 12% in a financial plan — that’s speculation territory.
Time horizon: How many years until you need the money. The difference between 30 years and 35 years is enormous — run both.
Tax treatment: Tax-advantaged accounts (Roth IRA, 401k, HSA) compound differently than taxable accounts. The VVS calculator accounts for both scenarios.
🎁 Free Compound Interest Calculator — Download Before You Continue
The free VVS Compound Interest Calculator below lets you input your exact numbers — including annual contribution increases — and see your 5-year, 10-year, 20-year, and retirement-age projections in one view. Most people find the 20-year number is the most motivating.
How the VVS Investment Growth Dashboard Works
The full VVS Investment Growth Tracker (in our Vault & Vessel Studio Etsy shop) goes beyond a single calculation. Here’s what it models:
You enter your current portfolio value, monthly contribution, expected return, and target retirement age. The dashboard projects your portfolio value at every 5-year interval, shows the breakdown between your contributions vs growth (the compound growth portion gets visually larger every decade), and calculates your savings rate impact — how much faster you’d hit your target if you increased contributions by $100, $200, or $500/month.
The tool also models contribution step-ups: if you increase your monthly investment by 3% each year (tracking rough inflation or modest income growth), the final projections are dramatically different than flat contributions. This is the feature that changes how people think about raises — instead of lifestyle inflation, you model what 50% of every raise going into investments does to your retirement timeline.
The Mistakes That Kill Compound Interest’s Power
Cashing out during downturns. Compound interest is destroyed by withdrawal. Every dollar you pull out during a market downturn doesn’t just cost you that dollar — it costs you every compounding cycle that dollar would have generated over the remaining investment horizon. The math on panic-selling is brutal.
Paying high fees. A 1% management fee sounds negligible. Over 30 years on a $500,000 portfolio, it costs you approximately $170,000 in compounding opportunity. Index funds with expense ratios under 0.05% (like Vanguard’s VTSAX or Fidelity’s FZROX) are the standard recommendation for a reason.
Using compound interest logic to justify debt. Credit card debt at 24% APR compounds against you with the same ferocity that investments compound for you. Paying off 24% debt is a guaranteed 24% return. No investment reliably beats that. Our debt payoff calculator guide shows how to sequence debt payoff vs investing.
What to Do With This Information Right Now
If you’re not investing yet, the action is to open an account today — not after you “learn more,” not after the market “settles down,” today. A Roth IRA at Fidelity or Vanguard takes 15 minutes to open. You can start with $50/month. The compounding cycle you start today is worth more than the larger contributions you’ll make in five years when you “have more figured out.”
If you’re already investing, run the step-up scenario. What happens if you increase contributions by $100/month starting now? By $200? The tool makes it take 30 seconds to answer that question. Most people find the answer is motivating enough to actually make the change.
Also worth reading: our $10,000 savings challenge guide pairs well with this — it shows how to build the cash buffer that lets you invest without fear, and our emergency fund guide explains why the foundation matters before you run compound interest calculations at full throttle.
The math on compound interest is patient. It doesn’t care when you start. It just starts working the moment you do.
The Actual Math: Why Starting Now Beats Waiting
Here’s the scenario I find most convincing. Two people, same ending age (65), same investment ($500/month into the same index fund at 7% average annual return).
Person A starts at 25. Contributes for 40 years. Total contributed: $240,000. Final balance: $1,311,000.
Person B starts at 35. Contributes for 30 years. Total contributed: $180,000. Final balance: $605,000.
Person A invested $60,000 more but ended with $706,000 more. The extra $706,000 came from one decade of compounding, not from the additional contributions. That extra decade at the beginning is worth more than any optimization you can do in the middle.
The Starting Smart Trap
The most common reason people delay investing: they want to learn more first. They’re waiting until they understand the “right” strategy, the right asset allocation, the right moment. This is expensive. The expected cost of a one-year delay starting at 25 — one year of not investing $500/month at 7% — is approximately $35,000 in final portfolio value at 65. You’re paying $35,000 in future wealth for one year of research time.
The market timing version of this is even more expensive. A 2022 study showed investors who tried to time the market vs. a buy-and-hold strategy underperformed by an average of 1.5% annually over 20 years. On a $500,000 portfolio, that’s $7,500/year in underperformance — or $150,000 over the same 20 years. Boring beats clever, almost every time.
The Specific Numbers by Starting Age
If you invest $500/month at 7% and want to know your approximate balance at 65:
- Start at 22: $1,585,000
- Start at 30: $812,000
- Start at 40: $305,000
- Start at 50: $104,000
The drop from starting at 22 vs. 30 is $773,000 — from just 8 years. That’s not a rounding error. That’s a retirement.
The counterintuitive truth about lump sum vs. dollar-cost averaging: if you get a windfall ($10,000 inheritance, tax refund, bonus), investing it all immediately beats spreading it out monthly about 66% of the time, according to Vanguard research. Markets go up more than they go down, so getting money invested sooner statistically wins. Most people spread windfalls over time to reduce regret risk — which is emotionally rational but financially suboptimal. Know which tradeoff you’re making.
Disclaimer: This article is for educational purposes only and does not constitute financial advice. Past investment performance does not guarantee future results. Consult a qualified financial advisor for personalized guidance.
Keep reading (related guides):
- Never Work Again Calculator: The Exact Number by Age
- How Much Money You Need to Retire Early at 40, 45, and 50 (Real Numbers by Age)
- How to Calculate Your Net Worth (And Why Its the Only Financial Number That Matters)
- Investing for Beginners: How to Start With Just $50 (And Actually Understand What Youre Doing)
- Bakery Revenue Calculator
255+ interactive tools for your money, time, and health.
Full features for 14 days · Secure payment · Stop anytime
Andy Gaber is the founder of Digital Dashboard Hub, a suite of 255+ interactive financial, productivity, and wellness tools. He built DDH after getting frustrated with financial apps that gave outputs without context. Follow along for tool tutorials, revenue analytics breakdowns, and honest takes on personal finance.