You’ve been tracking your period in an app that gives you a smiley face and a “your period is coming!” notification — while completely ignoring the bloating that started on day 14, the cystic acne that showed up on day 19, and the anxiety spike that hit on day 22. If you have PCOS, a basic period tracker is like monitoring a hurricane with a thermometer.
The DDH PCOS & Hormone Cycle Dashboard is a free interactive tracker built specifically for the complexity of polycystic ovary syndrome. It doesn’t just track when your period shows up (or doesn’t). It maps symptoms, medications, supplements, mood, energy, and cycle patterns across time — so you can walk into your next doctor’s appointment with actual data instead of “I think it’s been worse lately?”
Why Generic Period Trackers Fail PCOS
I built Digital Dashboard Hub after spending years looking for tools that actually worked without a spreadsheet degree. Here’s what I’ve learned:
Part of the problem? The data gap. When your cycles are irregular — sometimes 28 days, sometimes 67, sometimes who knows — apps that assume a 28-day cycle are worse than useless. They’re actively misleading. And when your symptoms span acne, hair loss, weight changes, mood shifts, insulin resistance, fatigue, and sleep disruption, no single-symptom tracker captures the full picture.
You need a dashboard that sees the connections between symptoms, not just a list of checkboxes.
What This Dashboard Actually Tracks
Symptom Correlation Heatmap. Log your daily symptoms — bloating, acne, fatigue, anxiety, cravings, hair loss, pain levels — and the dashboard builds a visual heatmap showing which symptoms cluster together and when in your cycle they peak. After 2-3 cycles, patterns emerge that you’d never catch from memory alone.
Medication & Supplement Log. Track metformin, spironolactone, birth control, inositol, vitamin D, berberine — whatever your protocol is. The dashboard maps your medication adherence alongside your symptom data so you can see if changes in your protocol are actually moving the needle.
Irregular Cycle Mapping. Forget the 28-day assumption. This tracker adapts to YOUR cycle length — whether that’s 35 days, 60 days, or completely unpredictable. It calculates your rolling average cycle length and flags significant deviations.
Hormone Health Score. A composite score (0-100) based on symptom severity, cycle regularity, medication adherence, and lifestyle factors. It’s not a medical diagnosis — it’s a trend tracker. Watching it move from 48 to 63 over three months tells you something is working.
Doctor Visit Prep Report. One click generates a summary of your last 3 cycles: symptom patterns, medication changes, cycle lengths, and your overall trend. Print it or screenshot it. Your endocrinologist will love you.
Lifestyle Factor Tracking. Sleep quality, exercise, stress levels, and diet tags. Because PCOS doesn’t exist in a vacuum — insulin resistance, cortisol, and inflammation all interconnect. The dashboard helps you see which lifestyle changes correlate with symptom improvement.
How It Works
Step 1: Open the dashboard and set up your symptom categories. The defaults cover the most common PCOS symptoms, but you can add custom ones for your specific experience.
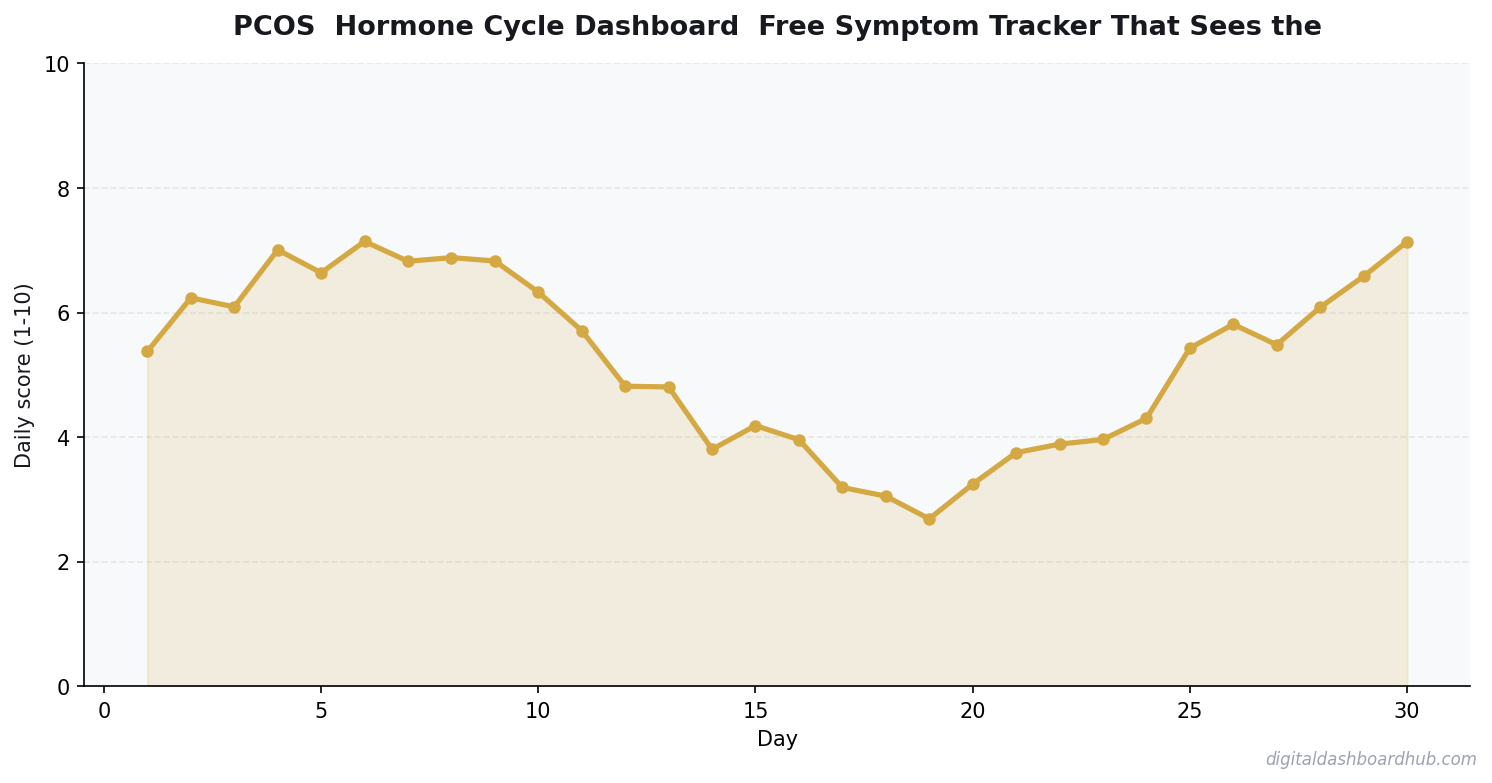
Step 2: Spend 60 seconds each morning logging: symptoms (severity 1-5), medications taken, sleep quality, and a quick mood/energy check. That’s it.
Step 3: After your first full cycle, start reviewing the heatmap and trend charts. By cycle 3, you’ll have more actionable data about your PCOS than most patients accumulate in a year.
Built for Real PCOS Management
| Feature | Period Tracker App | DDH PCOS Dashboard |
|---|---|---|
| Irregular cycle support | Assumes 28 days | Adapts to any length |
| Multi-symptom heatmap | No | Yes — visual correlations |
| Medication tracking | Basic or none | Full protocol logging |
| Doctor visit prep report | No | One-click summary |
| Hormone Health Score | No | Composite trend score |
| Lifestyle factor correlation | No | Sleep, diet, exercise, stress |
| Price | Free-$10/mo | Free to try |
FREE BONUS: The PCOS Symptom Severity Cheat Sheet
A one-page reference guide showing how to rate 15 common PCOS symptoms on a 1-5 scale — so your daily logging is consistent and your data is actually comparable month to month. Includes space for your doctor’s notes.
Get instant access when you sign up below.
Try the PCOS & Hormone Cycle Dashboard
Your PCOS is complex. Your tracker should be too — but simple to use. 60 seconds a day gives you more insight than most people get from years of guessing.
Try it free and start mapping your cycle today → app.digitaldashboardhub.com/signup
Available as a Google Sheets dashboard and interactive web app. Also on Etsy.
Keep Reading
- PCOS Symptom Tracking: A Complete Guide
- Period Tracking 101: Understanding Your Menstrual Cycle
- The Complete Guide to Fertility Tracking
What Your PCOS Data Is Actually Telling You
PCOS symptoms don’t look the same every month — and they shouldn’t. Estrogen, progesterone, and androgen levels shift constantly, and what triggers a flare in week 2 of your cycle may be totally irrelevant in week 4. This is why “just track your symptoms” advice without cycle context produces data that looks random even when it isn’t.
The dashboard pairs symptoms with cycle day specifically because that context is what turns a list of complaints into an actionable pattern. Day 1-5 bloating is different from day 14-16 bloating — they have different hormonal drivers and different interventions.
The 3 Patterns That Show Up First in PCOS Tracking
- Sleep-symptom correlation: Most PCOS sufferers see a strong link between less than 7 hours of sleep and next-day symptom severity. It shows up in your data within 2-3 weeks of consistent logging.
- Carbohydrate timing: For women with insulin-resistant PCOS (the most common type), carbohydrate intake in the first half of the day consistently produces fewer symptoms than the same calories later. This often appears in food-symptom data before any other dietary pattern.
- Stress lag: Cortisol spikes from stress show up as PCOS flares 2-3 days later, not the same day. If you’re logging stress and not seeing a same-day correlation, look at 48-72 hour lag instead.
When to Take Your Data to a Doctor
After 60-90 days of tracking, you’ll have something more valuable than a list of symptoms: a documented pattern. Bring that pattern, not just a verbal summary. Doctors make better treatment decisions when they see 3 months of logged data instead of a 10-minute office visit’s worth of recall.
Specifically flag: any luteal phase that’s consistently shorter than 10 days, any month where you can’t identify an ovulation window at all, and any symptom cluster that’s getting consistently worse rather than variable. These are worth prioritizing in an appointment over general symptom discussion.
What Most PCOS Trackers Miss
The symptom-only approach misses half the picture. PCOS affects mood, energy, cognitive function, and sleep quality — not just physical symptoms. If you’re only logging the “classic” markers (acne, bloating, hair loss), you’re missing the data that helps explain the days when everything feels harder and you don’t know why. Log all of it. The correlations between mental and physical symptoms are often the most actionable findings in the first 90 days.
Keep reading (related guides):
- Free Sinking Fund Calculator — Try It Now
- Free Menopause Symptom Tracker — Try It Now
- Nervous System Regulation Tracker: The Visual Dashboard That Helps You Understand Your Bodys Stress Signals
- I Owed $47,000 in Taxes and Had $11,000 in the Bank: How I Rebuilt My Freelance Finances From the Ground Up
- Free PCOS Symptom Tracker Dashboard — Try It Now
255+ interactive tools for your money, time, and health.
14-day trial · Stripe checkout · Cancel anytime
Disclaimer: This tool is for informational and educational purposes only. It is not medical advice and should not replace consultation with a qualified healthcare provider. Always discuss PCOS management with your doctor.
Common Questions About PCOS & Hormone Cycle Dashboard: Free Symptom Tracker That Sees the Full Picture
How long does it take to see results?
Most people see meaningful progress within 30-90 days when they apply these strategies consistently. The key is tracking your numbers from day one so you have a baseline to measure against.
What’s the biggest mistake people make?
Trying to do everything at once. Pick one or two strategies from this guide, implement them fully, then layer in additional tactics. Spreading yourself thin is the fastest way to see no results from any of it.
Do I need special tools or software?
Not necessarily to start — but the right tools eliminate hours of manual work. Our free calculators and trackers at Digital Dashboard Hub are a good starting point before you invest in paid software.

Andy Gaber is the founder of Digital Dashboard Hub, a suite of 255+ interactive financial, productivity, and wellness tools. He built DDH after getting frustrated with financial apps that gave outputs without context. Follow along for tool tutorials, revenue analytics breakdowns, and honest takes on personal finance.