Everyone has an opinion on this. Your parents say buy. Your financial advisor says run the numbers. Your landlord just raised rent again, which makes buying feel urgent. But “urgency” is a terrible reason to make a $400,000 decision.
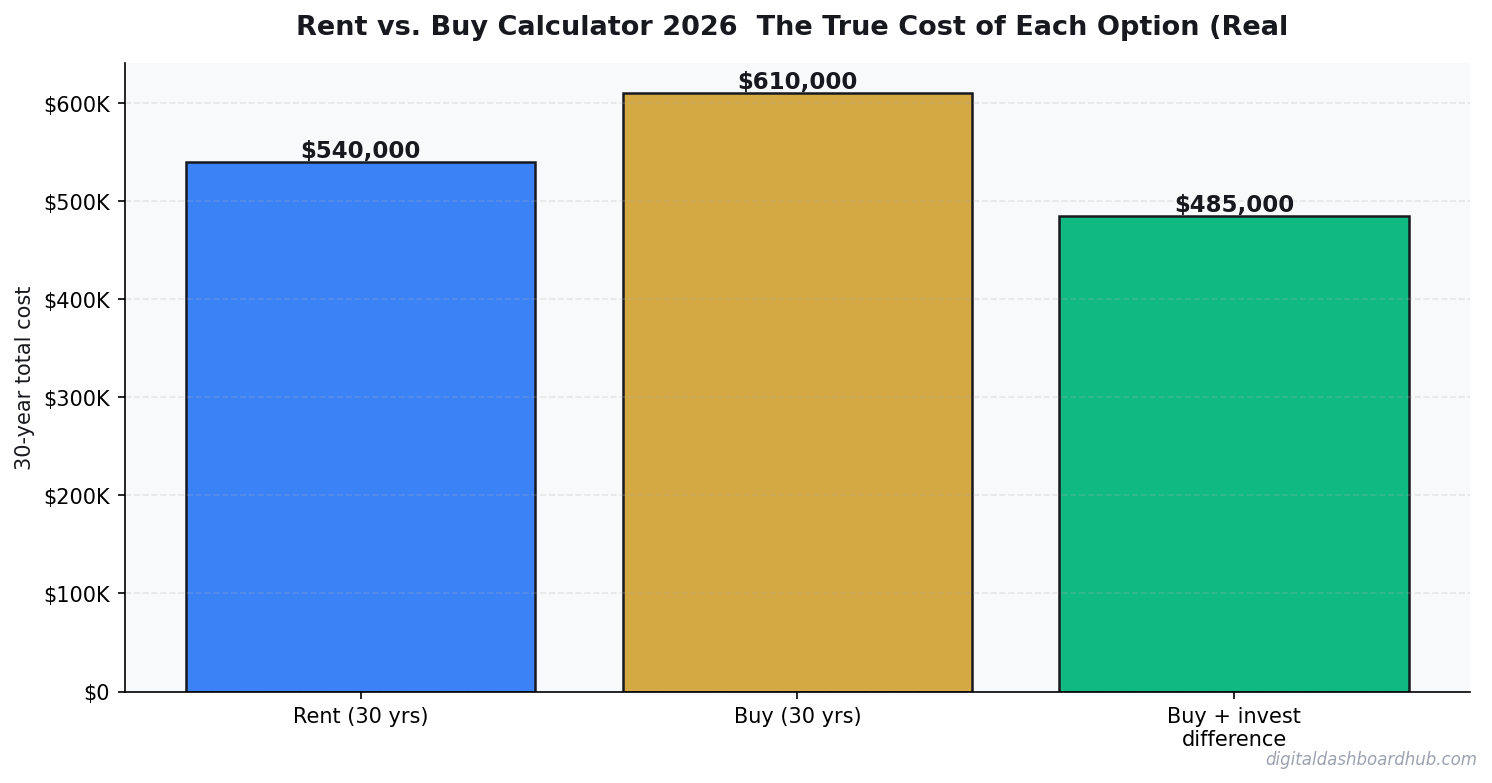
Here’s what the rent vs buy debate actually comes down to in 2026: it depends on your market, your timeline, and what you do with the money you’d otherwise put toward a down payment. And the answer is genuinely different for different people in different cities. The DDH rent vs buy calculator 2026 runs the full comparison — not just monthly payment vs. rent, but total cost of ownership, equity built, opportunity cost of the down payment, and the true break-even point.
Why the “Just Buy” Advice Is Wrong (And So Is “Just Keep Renting”)
Conventional wisdom says buying builds equity while renting throws money away. This is half true and half misleading.
The renting-throws-money-away myth: When you own, roughly 70–80% of your early mortgage payments go to interest. On a $400,000 home at 7%, your first mortgage payment of $2,661 includes $2,333 in interest and only $328 in principal. That’s 87.7% interest. That’s not building equity — that’s paying your bank.
The buying-always-wins myth: This ignores appreciation uncertainty, transaction costs, opportunity cost of the down payment, and the years it takes to break even. In high-cost markets, it can take 7–12 years before buying beats renting financially.
The actual right answer is: run the numbers for your specific situation with a calculator that doesn’t have a predetermined conclusion.
What the Rent vs. Buy Calculator Compares
On the buying side, the calculator includes: mortgage payment, property taxes, homeowner’s insurance, HOA fees, PMI (if applicable), maintenance and repairs, closing costs, and equity built over your time horizon.
On the renting side, the calculator includes: monthly rent with annual increase, renter’s insurance, and — crucially — opportunity cost of the down payment invested in the market instead.
That last one is where most rent-vs-buy calculators fail. If you put $80,000 toward a down payment, that’s $80,000 that didn’t go into an index fund. Over 10 years at 7% average annual return, that $80,000 would have grown to $157,000. That’s the real cost of buying — and it matters.
The 2026 Math: What Buyers Are Actually Facing
On a $400,000 home with 20% down:
| Scenario | Rate | Monthly P&I | Annual Interest (Year 1) |
|---|---|---|---|
| 30-year fixed | 6.75% | $2,076 | $21,424 |
| 15-year fixed | 6.25% | $2,743 | $18,750 |
| 30-year fixed | 7.25% | $2,180 | $23,040 |
Add $400–600 in property taxes, $150–200 in insurance, $250–400 in maintenance reserves — and you’re looking at $2,876–3,376/month total housing cost on a $400,000 home with 20% down.
In many markets, you can rent comparable housing for $2,000–2,800/month. That gap of $400–900/month is money going to equity (very slowly at first), to appreciation (uncertain), and to transaction costs you’ll pay again when you sell.
FREE BONUS: The Rent vs. Buy Decision Worksheet
A one-page framework for the 8 factors that matter most for your specific situation — market, timeline, life plans, job stability.
Get instant access → app.digitaldashboardhub.com/signup
How the DDH Rent vs. Buy Calculator Works
Let’s run a real comparison: Atlanta, Georgia. $380,000 home. 20% down ($76,000). 7.0% mortgage rate.
Buying costs (Year 1):
- Mortgage (P&I): $2,024/month = $24,288/year
- Property taxes (1.2% of value): $380/month = $4,560/year
- Insurance: $175/month = $2,100/year
- Maintenance (1%/year): $317/month = $3,800/year
- Total: $2,896/month = $34,752/year
Equity built in Year 1:
- Principal paid: $3,720
- Appreciation (conservative 3%): $11,400
- Net equity gained: $15,120
True annual cost of buying: $34,752 – $15,120 + $5,320 (opportunity cost of $76K down payment) = $24,952/year
Now the renter scenario, same Atlanta market:
- Rent for comparable 3BR: $2,100/month = $25,200/year
- Renter’s insurance: $300/year
- Down payment invested: earning $5,320/year
- True cost of renting: $20,180/year
In this scenario, renting is $4,772/year cheaper in Year 1. That gap shrinks every year as rents increase but the mortgage P&I stays fixed. The break-even in this Atlanta example: approximately Year 6–7. If you’re staying 7+ years, buying probably wins. Under 5 years, renting wins.
→ Run your city’s comparison: app.digitaldashboardhub.com/signup
Market-by-Market Reality Check
High-cost, slow-appreciation markets (NYC, LA, SF bay area): Break-even on buying is often 10–15 years. Renting is clearly better for most people who don’t plan to stay long.
Mid-cost, moderate-appreciation markets (Atlanta, Dallas, Phoenix, Denver): Break-even is 5–8 years. Buying makes sense for people with stable plans to stay.
Low-cost, high-appreciation markets (parts of Midwest and Southeast): Break-even can be 2–4 years. Buying often makes obvious financial sense.
The calculator lets you enter your specific market’s median rent, home prices, and historical appreciation rate. Most users are surprised by how much their city’s math deviates from national averages.
The Qualitative Factors the Calculator Can’t Measure
Stability: Are you planning to stay in this city for 5+ years? Job changes, relationship changes, and life moves are the #1 reason people sell homes too early and absorb massive transaction costs.
Control: Owning means you can paint the walls, get a dog, and renovate the kitchen. Renting means your landlord can sell the property or raise rent. Neither is universally better.
Stress: A 2023 survey found homeowners report higher housing-related stress than renters in the first three years of ownership — driven by maintenance costs, market anxiety, and financial strain of the purchase.
Renting Isn’t “Giving Up”
The biggest psychological barrier to running this analysis honestly is that buying feels like success and renting feels like failure. That framing costs people money.
A renter who invests their down payment and the monthly cost difference between renting and owning isn’t throwing money away — they’re building wealth. Potentially faster than the buyer next door, depending on the market and timeline.
Your Next Move
1. Right now (10 minutes): Enter your city’s current rental rates and comparable home prices into the DDH calculator. Find your actual break-even year.
2. This week: Identify your honest timeline. How long do you realistically expect to live in this city? This single variable changes the calculator’s recommendation more than almost anything else.
3. Long game: If buying wins for your situation, use the DDH Mortgage Comparison Calculator to find your best loan. If renting wins, use the savings tracker to invest the difference each month.
Still here? Good.
The people who run these numbers before deciding almost always make better financial choices. Join 1,200+ people using DDH calculators for big financial decisions. Free for 14 days.
Compare your numbers → app.digitaldashboardhub.com/signup
Keep reading (related guides):
- True Cost of Your Mortgage Calculator: Its More Than the Payment
- Rental Property ROI Calculator: Is This Deal Actually Worth It?
- Wedding Budget Breakdown: Where Every Dollar Should Go (Free Calculator)
- Homeownership vs. Renting for 30 Years: The Complete Financial Comparison
- Bakery Revenue Calculator
255+ interactive tools for your money, time, and health.
Full features for 14 days · Secure payment · Stop anytime
Keep Reading
- Mortgage Comparison Calculator: Find the Best Rate and Term
- How Sinking Funds Saved Me From Financial Emergencies
- Freelancer Finance Dashboard: Track Income, Taxes, and Cash Flow
Common Questions About Rent vs. Buy Calculator 2026: The True Cost of Each Option (Real Numbers)
How long does it take to see results?
Most people see meaningful progress within 30-90 days when they apply these strategies consistently. The key is tracking your numbers from day one so you have a baseline to measure against.
What’s the biggest mistake people make?
Trying to do everything at once. Pick one or two strategies from this guide, implement them fully, then layer in additional tactics. Spreading yourself thin is the fastest way to see no results from any of it.
Do I need special tools or software?
Not necessarily to start — but the right tools eliminate hours of manual work. Our free calculators and trackers at Digital Dashboard Hub are a good starting point before you invest in paid software.

Andy Gaber is the founder of Digital Dashboard Hub, a suite of 255+ interactive financial, productivity, and wellness tools. He built DDH after getting frustrated with financial apps that gave outputs without context. Follow along for tool tutorials, revenue analytics breakdowns, and honest takes on personal finance.