You set a goal to hit 10,000 YouTube subscribers by Q2. You made a content calendar, posted consistently, optimized titles and thumbnails. Three months passed. You gained 2,000 subscribers.
The goal system didn’t fail because you didn’t work hard. It failed because you were measuring the wrong thing at the wrong frequency.
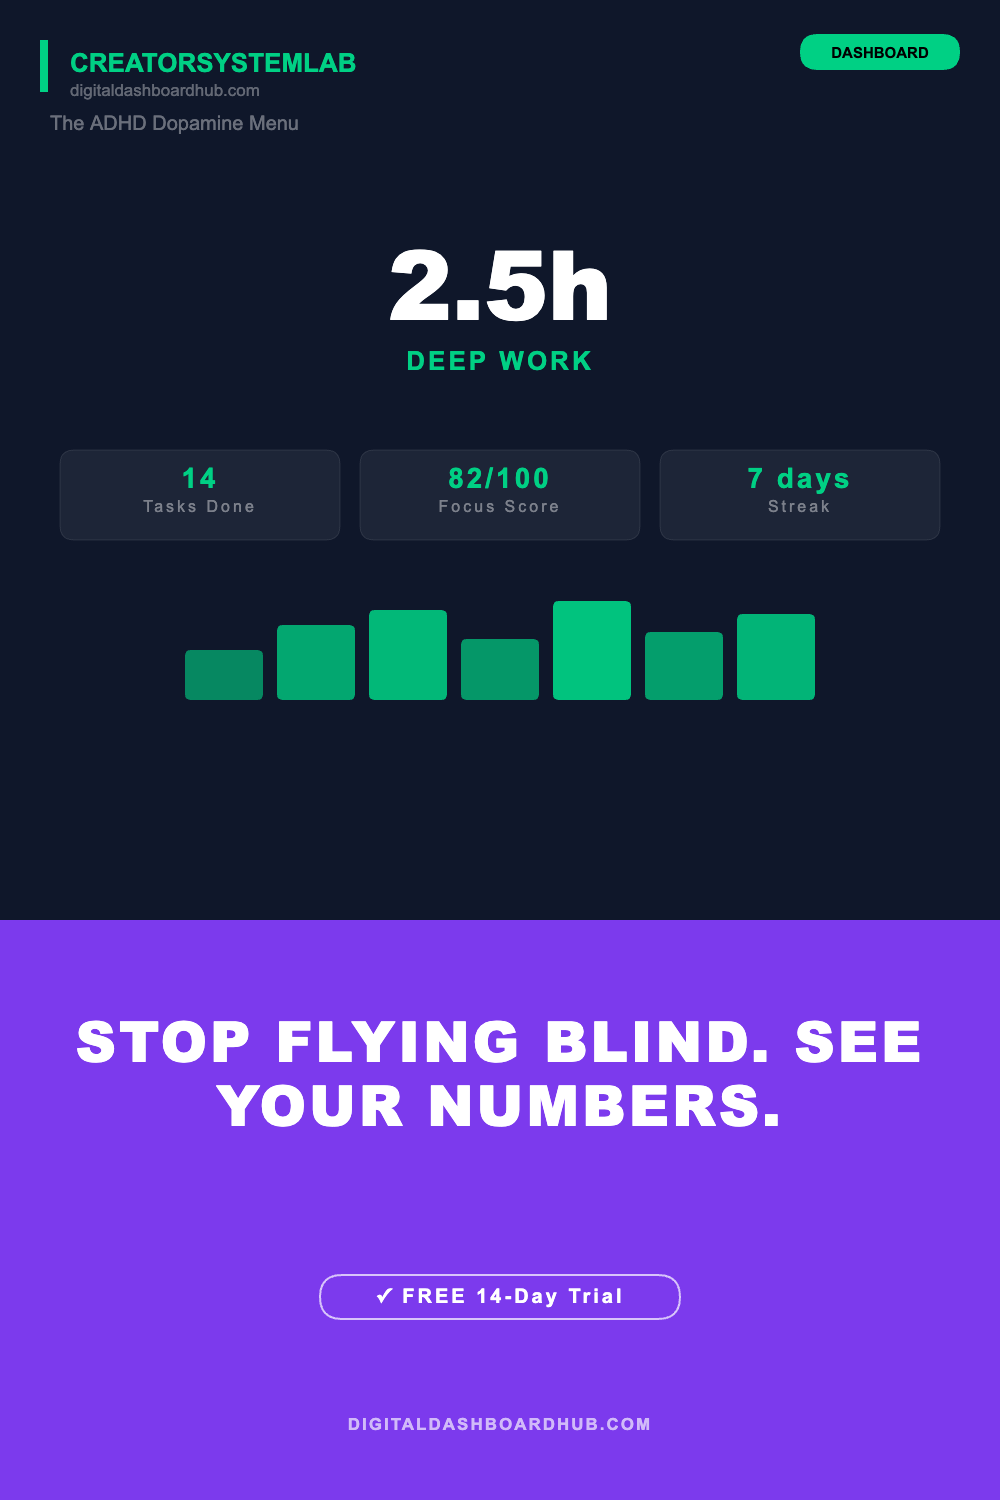
Creator OKR Dashboard
Quarterly goals tracker with OKR framework, key results scoring & visual progress charts
Get the OKR Dashboard →
This article breaks down why traditional goal systems collapse for creators, and shows you the one framework that actually works: leading indicators tracked weekly on a simple scorecard.
Why SMART Goals Fail Creative Entrepreneurs
After testing dozens of approaches with DDH users, I’ve found what consistently works. Let me share the real picture:
SMART goals sound logical: Specific, Measurable, Achievable, Relevant, Time-bound. Your business coach probably recommended them. They work beautifully for launching a marketing campaign or closing a client project.
But here’s where they break down for creators:
The Algorithm Problem
Your lagging indicator (final result) is partly outside your control. Post an identical YouTube video on two different days, and one gets 2x the views. The same Etsy product listing sells 15 units one week and 2 units the next — same product, same marketing effort, different algorithm position.
When your goal depends partially on forces you can’t control, traditional goal systems create two problems:
- False failure: You work your hardest, execute perfectly, and miss the goal because the algorithm didn’t cooperate. You feel demotivated despite doing everything right.
- Vanity metrics: You chase what looks impressive instead of what actually drives business growth. 10,000 followers who never buy is different from 2,000 followers who generate $5,000/month revenue.
The Inspiration Cycle Reality
Creative work doesn’t run on quarterly schedules. Some weeks you’re bursting with ideas and produce three high-quality videos. Other weeks your creative tank is empty and you’re recycling concepts. Forcing a linear goal progression (“upload 12 videos, grow 25% each quarter”) ignores the seasonal nature of creative output.
Professional creators know this. They batch-create during high-inspiration periods. They rest and replenish during low periods. A goal system that doesn’t accommodate creative cycles doesn’t fit creative work.
The Measurement Lag Problem
Traditional goal systems check in quarterly. “How are we doing on that 10,000 subscriber goal?” By the time you get your answer, 12 weeks have passed. If you’re off track, you’ve already wasted 12 weeks on tactics that aren’t working.
For creators operating with thin margins and limited time, quarterly reviews are too infrequent. You need feedback weekly — sometimes even daily — to adjust what you’re doing and course-correct fast.
Leading Indicators vs. Lagging Indicators: The Framework Shift
Here’s the key insight that changes everything: stop measuring only lagging indicators. Start measuring leading indicators.
A lagging indicator is the result: subscribers, followers, revenue, sales volume. It’s what you want, but you can’t directly control it. It’s also reported weeks or months after you take action.
A leading indicator is the action: posts published, content pieces created, outreach messages sent, product iterations tested. It’s something you directly control, and you see the results immediately.
Example breakdown for a YouTube creator:
- Lagging indicator: 10,000 subscribers by June 30 (you can’t directly control this)
- Leading indicators: 8 videos published per month, average watch time 4+ minutes, thumbnails tested with 2 variations, SEO keywords researched and included in descriptions
When you crush your leading indicators consistently, the lagging indicator follows — but with a 4-6 week delay. That’s why weekly tracking matters. You need to know if your leading indicators are on track before waiting 90 days for the lagging indicator to confirm it.
An Etsy seller applies this differently:
- Lagging indicator: $3,000 revenue per month
- Leading indicators: 3 new product listings published, 2 competitive product analyses completed, 5 customer photos featured in marketing, 8 different keywords tested in listing optimization
The Etsy algorithm rewards fresh inventory, optimized listings, and user-generated content. If you publish 3 new listings weekly and test new keywords, revenue growth follows naturally.
The Weekly Scorecard Framework: What to Measure and How
A creator goal scorecard is simple: it’s a spreadsheet or document where you track your leading indicators weekly. You measure two things:
- Effort metrics (what you control): content created, projects completed, connections made
- Result metrics (what follows effort): engagement, views, sales, growth
You don’t do this monthly or quarterly. You do this weekly.
Why Weekly?
Weekly feedback loops are tight enough to catch problems early, but wide enough to see patterns. One week of missed content targets? Probably just a busy week. Four weeks of missed targets? You’ve got a real problem to solve.
Here’s a real example: Sarah, a YouTube creator in the personal finance space.
Sarah’s goals for Q2:
– Hit 50,000 subscribers (lagging)
– Double monthly revenue to $2,000 (lagging)
Her weekly scorecard tracks:
– Scripts written: Target 2/week
– Videos uploaded: Target 2/week
– Average watch time: Target 4+ minutes
– Thumbnail variations tested: Target 2/week
– Email list growth: Target 50 new signups/week
– Community engagement: Target 15 comments/week responded to
Week 1 results: Scripts (2 ✓), Videos (1 ✗), Watch time (3.5 min ✗), Thumbnails (2 ✓), Emails (45 ✗), Engagement (8 ✗)
What does Sarah learn? The video production is lagging. By week 2, she could adjust: batch-create scripts with a partner, or simplify thumbnail designs to save time. By week 3, she’s back on track. Meanwhile, watch time recovered to 4.2 minutes just from minor thumbnail and SEO tweaks.
This granular weekly feedback prevented a full-quarter derailment.
Real Example: Etsy Seller Performance
Marcus sells handmade woodworking items on Etsy. He wants $4,000/month revenue by July.
His weekly scorecard:
| Metric | Target | Week 1 | Week 2 | Week 3 | Week 4 |
|---|---|---|---|---|---|
| New listings published | 2 | 2 | 1 | 2 | 3 |
| Listings optimized (tags/keywords) | 3 | 2 | 4 | 3 | 3 |
| Customer messages responded to (hours) | 2 | 1.5 | 2.5 | 1.8 | 2.2 |
| Product photos added to listings | 8 | 6 | 10 | 7 | 9 |
| Weekly revenue | — | $580 | $620 | $710 | $850 |
By week 4, Marcus sees that weeks with higher photo additions (week 2, week 4) correlate with higher revenue. He adjusts his effort: hire a photographer to batch photos weekly. This leading indicator shift directly impacts lagging revenue within 1-2 weeks.
Without weekly tracking, Marcus would have waited until end-of-month ($2,760 total) and missed the pattern entirely.
Building Your Creator Goal Scorecard: Step-by-Step
Here’s exactly how to build your own scorecard:
Step 1: Identify Your One Lagging Goal
Pick one primary outcome you want in the next 90 days. One. Not five. Just one.
Examples:
– Hit 50,000 YouTube subscribers
– $5,000/month Etsy revenue
– 10,000 email subscribers
– Land 5 brand partnership deals
Step 2: Reverse-Engineer to Leading Indicators
What activities directly create that outcome? Work backward from your goal.
If your goal is YouTube subscribers:
– What do viewers watch repeatedly? Longer watch times = better algorithm visibility
– What do they engage with? Comments and shares signal ranking
– What do they search for? SEO keywords matter
– Working backward: publish videos consistently with high watch time, optimize for searchable keywords, encourage comments
If your goal is Etsy revenue:
– What drives Etsy algorithm visibility? New listings, tag optimization, seasonal trends
– What increases conversion rate? Better product photos, customer reviews, clear descriptions
– Working backward: publish new listings weekly, add professional photos, generate customer reviews
Step 3: Set Weekly Targets, Not Monthly or Quarterly
Break your 90-day goal into 13 weeks. What weekly progress moves you toward it?
Goal: 50,000 subscribers in 13 weeks (currently 35,000)
– Need: 1,154 new subscribers/week
– If average video gets 300 views and 2% subscriber conversion: need 77 videos/week… wait, that’s wrong.
– Reframe: you probably publish 2-3 videos/week. Average view velocity should be ~6,000 views/video to get 1,154 subs/week.
– Leading indicator: maintain 6,000+ views per video (track weekly average)
The weekly target is measurable and achievable. Month-to-month or quarter-to-quarter targets are too vague.
Step 4: Track and Review Every Sunday
Spend 15 minutes every Sunday evening reviewing the past week:
– Did you hit your leading indicators?
– What lagging indicators moved?
– What blockers came up?
– What will you adjust for next week?
This simple ritual is the difference between a goal system that works and one that sits unused.
A Freelancer’s Perspective: Services Over Products
Jamie is a freelance designer offering brand strategy and web design services. Revenue goals are less about volume and more about client quality and project scope.
Her weekly scorecard:
– Portfolio pieces completed: 1/week
– Client proposals sent: 2/week
– Cold outreach (LinkedIn messages): 5/week
– Website traffic: 400/week
– Inbound inquiries from website: 2/week
– Project value in pipeline: 5x monthly revenue goal
Notice these aren’t about “closing deals” (lagging). They’re about visibility and pipeline building (leading). By maintaining consistent outreach and showcasing strong work weekly, quality client inquiries follow naturally within 2-3 weeks.
When Jamie reviews week 4 and sees only 3 cold outreach messages sent (vs. 5 target), she knows her pipeline will dry up in 2-3 weeks. Immediate course correction: block 30 minutes daily for outreach Monday-Friday.
Adjusting Your Scorecard: Monthly Pivots, Not Quarterly Overhauls
A scorecard isn’t set-it-and-forget-it. But you don’t overhaul it every week either. Here’s the rhythm:
- Weekly review (Sunday evening): Did I hit targets? What blockers came up? Adjust execution only.
- Monthly assessment (end of month): Are leading indicators moving the lagging indicator? Do I need different leading indicators?
- Quarterly reset (every 13 weeks): New goal, new scorecard.
Example: Sarah tracks “thumbnails tested: 2/week” for four weeks. Lagging indicators show no correlation between thumbnail variations and watch time. This means testing thumbnails isn’t a high-impact leading indicator for her audience.
Monthly adjustment: replace with “SEO keyword optimization: 3 videos/week” instead. Different leading indicator, same measurement frequency.
The Numbers Behind Consistent Tracking
Creators who use weekly scorecards report:
- 3-4x faster feedback loops compared to quarterly reviews
- 40% higher goal achievement rates because they catch and correct course weekly instead of off-track for months
- 20-30% time savings by identifying low-impact activities within 2-3 weeks instead of 12+ weeks
- Better work-life balance from focused efforts instead of scattered, low-confidence attempts at multiple goals
These aren’t small improvements. A weekly scorecard is the difference between hoping your goal system works and knowing it’s working.
Measuring Revenue and Business Health Simultaneously
Many creators separate their creative goals from business goals. Don’t. They’re connected.
Your scorecard should track both:
Creative leading indicators:
– Content published weekly
– Quality benchmarks (watch time, engagement rate, conversion rate)
– Audience feedback and requests
Business leading indicators:
– Revenue per content piece
– Customer acquisition cost (if paid ads)
– Product/service variations tested
– Customer retention rate
– Email list growth
For example, a creator earning $2,000/month from YouTube might track:
– 8 videos/week published
– 4+ minute average watch time
– 12 sponsorship/partnership inquiries tracked
– $250+ revenue/video
When revenue per video drops from $300 to $200, you know to investigate: Did watch time drop? Are fewer sponsorships responding? Are YouTube CPM rates down? Leading indicators help you diagnose the real problem.
Your Next Step
You now understand why traditional goal systems fail creators and what actually works. The pattern is simple: measure leading indicators weekly instead of waiting for quarterly lagging indicator reports.
The question is: are you going to implement this framework, or let another quarter slip by with vague goals and no feedback?
The difference is a 15-minute weekly review and a simple scorecard.
Grab Our Free Creator Goal Scorecard Template
Ready to stop guessing and start tracking what actually moves your creative business forward? We built a free Creator Goal Scorecard Template that gives you the exact weekly tracking framework described in this article — with pre-built formulas, example metrics for different creator types, and a simple review checklist.
What’s included:
– Weekly tracker with 13-week projection
– Pre-filled leading indicators for YouTube, Etsy, Freelance, and Email-based creators
– Revenue integration so you see profit alongside output
– Monthly shift checklist for course corrections
– Bonus: comparison view to spot your highest-ROI activities
👉 Download the Free Creator Goal Scorecard Template — Delivered straight to your inbox. No spam, ever.
Can’t wait? Start tracking this week with these resources:
- Creator Goal Scorecard — Pre-designed, done-for-you template with all metrics built in.
- Creator OKR Dashboard — For creators managing multiple quarterly goals simultaneously.
- Content Calendar Google Sheets — Plan your leading-indicator content weekly.
- Content Calendar Planner HTML — Interactive weekly planning with real-time updates.
- Weekly Revenue Tracker — Track income alongside effort.
Your first weekly scorecard review happens Sunday. Make it count.
Keep reading (related guides):
- Free Side Hustle Income Tax Tracker — Try It Now
- Side Hustle Income Tax Tracker: The Free Dashboard That Keeps April From Destroying You
- I Owed $47,000 in Taxes and Had $11,000 in the Bank: How I Rebuilt My Freelance Finances From the Ground Up
- How to Build a Bulletproof Freelancer Finance System in 7 Steps (Even If Numbers Make You Nauseous)
- Sinking Fund Savings Goal Planner: The Free Visual Dashboard That Kills Surprise Expenses
255+ interactive tools for your money, time, and health.
Full features for 14 days · Secure payment · Stop anytime
Disclaimer: This article is for informational purposes only and does not constitute professional advice. Always consult with a qualified professional for your specific situation.
Keep Reading
- Freelancer Finance Management Dashboard (VVS): Finally, a Money Tool Built for Variable Income
- Freelancer Finance Dashboard: Track Income, Taxes, and Cash Flow in One Visual Hub
- A/B Testing Your Etsy Listings: How to Know What’s Actually Working
Andy Gaber is the founder of Digital Dashboard Hub, a suite of 255+ interactive financial, productivity, and wellness tools. He built DDH after getting frustrated with financial apps that gave outputs without context. Follow along for tool tutorials, revenue analytics breakdowns, and honest takes on personal finance.