Nobody Prepares You for the Fourth Trimester
Enter your own numbers in the interactive tool below and get a real-time read. The dashboard version adds saved scenarios, history, and full feature access.
You spend 9 months preparing for the birth. Reading books, taking classes, building a nursery, researching the perfect car seat. Then the baby arrives and suddenly you’re bleeding, sleep-deprived, emotionally wrecked, and expected to just… figure it out. The medical system hands you a 6-week postpartum checkup and essentially says “good luck until then.”
In This Article
- Nobody Prepares You for the Fourth Trimester
- What New Moms Actually Need to Track (That Nobody Tells You)
- The 6 Apps I Tested: Honest Comparison
- The Baby Tracker Problem
- Postpartum Depression Screening: Why Your App Should Include It
- What the First 12 Weeks Look Like (Real Data)
- How the DDH Postpartum Dashboard Handles This
- Tracking Mistakes That Cost Me Months
- Red Flags: When to Stop Tracking and Start Calling
- What I Wish I’d Known Before Week 1
I went looking for a postpartum recovery tracker at 4 AM on day 3 with a newborn on my chest, tears on my face, and no idea if what I was experiencing was normal. What I found was a mess — generic baby tracking apps that focused on the infant and completely ignored the recovering mother, or mood apps that weren’t built for the specific chaos of the postpartum period. So I tested everything I could find and built the comparison I wish I’d had.
What New Moms Actually Need to Track (That Nobody Tells You)
Your OB-GYN will ask about bleeding and mood at your 6-week visit. That’s about 10% of what’s happening in your body and mind during postpartum recovery. Here’s the full picture:
🔑 The first 14 days are the hardest. After that, tracking becomes automatic — like checking the weather.
Physical recovery markers: Lochia (postpartum bleeding) — color, amount, and duration tell you a lot about uterine healing. Pelvic floor function. Incision healing (if C-section). Breast pain, engorgement, or mastitis symptoms. Pain levels throughout the day. Physical energy on a 1-10 scale.
Mental health indicators: Mood (beyond just “happy/sad” — postpartum mood disorders have specific symptom profiles). Anxiety levels. Intrusive thoughts (common but rarely discussed). Rage episodes (postpartum rage is a real thing and different from depression). Bonding feelings with baby (these fluctuate and that’s normal).
Feeding data: Whether breastfeeding, pumping, formula, or combo feeding — what’s working, what’s painful, output volumes. This data is crucial for lactation consultants and pediatric visits.
Sleep architecture: Not just “how much sleep did you get” but the pattern — 45 minutes here, 2 hours there, a 20-minute nap during a feeding. Postpartum sleep deprivation is qualitatively different from regular bad sleep because it’s fragmented, involuntary, and indefinite.
The 6 Apps I Tested: Honest Comparison
The Baby Tracker Problem
The most popular postpartum apps — Huckleberry, Baby Tracker, Sprout — track the baby beautifully. Feeding times, diaper counts, sleep schedules, growth percentiles. But here’s my problem with them: they treat the mother as invisible.
Where in Huckleberry do I log that I’m bleeding through pads every 2 hours? Where in Baby Tracker do I note that I had a rage episode so intense I scared myself? Where in Sprout do I track that my pelvic floor is so weak I can’t walk to the mailbox without leaking?
These apps optimize for baby wellness — which matters. But the mother’s recovery is literally the infrastructure that baby wellness depends on. A mother who isn’t tracking her own recovery, who doesn’t notice the warning signs of postpartum depression or hemorrhage, is a mother at risk. And a mother at risk puts baby at risk.
Postpartum Depression Screening: Why Your App Should Include It
The Edinburgh Postnatal Depression Scale (EPDS) is a 10-question validated screening tool that takes 5 minutes to complete. Research shows that 1 in 7 new mothers experience postpartum depression (CDC, 2023), and many cases go undetected because the symptoms overlap with “normal” new-parent exhaustion.
Of the 6 apps I tested, only one (Postpartum Plan) included the EPDS as a built-in feature. The DDH Postpartum Dashboard includes a modified postpartum mood check that flags concerning patterns and suggests seeking help when scores trend in a concerning direction over multiple days.
Why does this matter in an app? Because most new mothers don’t recognize postpartum depression in themselves. The cultural narrative around new motherhood focuses so heavily on joy that admitting you feel nothing — or worse, feel resentment toward your baby — feels like failure. An app that regularly asks targeted mood questions normalizes the experience and catches deterioration early.
If you’re scoring above 12 on the EPDS or experiencing thoughts of self-harm or harming your baby, contact Postpartum Support International’s helpline at 1-800-944-4773 or text “HELP” to 988. This is not something to track and wait on — it’s something to address immediately.
What the First 12 Weeks Look Like (Real Data)
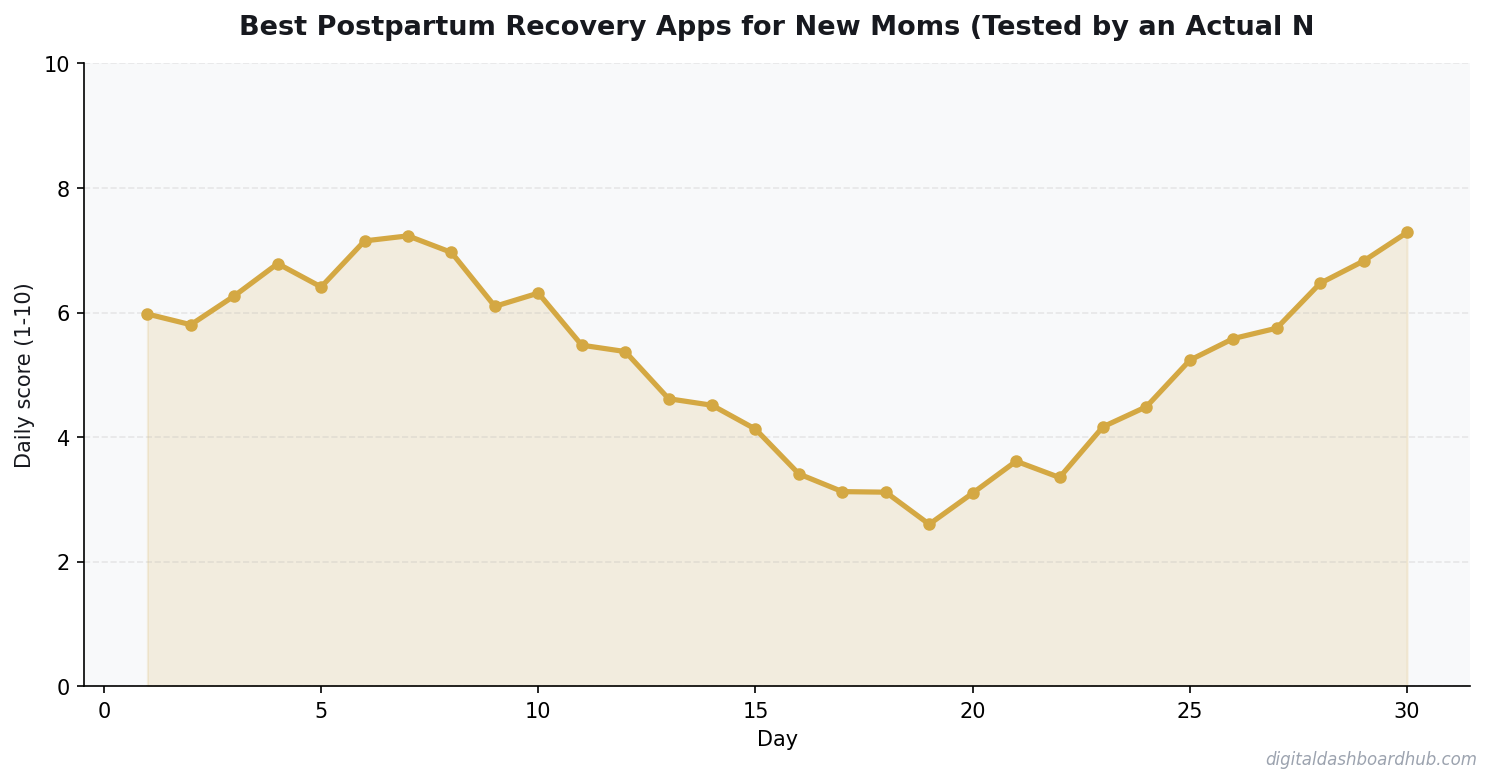
I tracked my recovery daily for 12 weeks. The actual results the data showed:
Weeks 1-2: Survival mode. Sleep averaged 3.2 hours per night (fragmented). Physical pain averaged 7/10. Mood swings were extreme — sobbing at commercials one minute, feeling euphoric holding the baby the next. This is the “baby blues” period (affects up to 80% of new mothers) and it’s driven by the most dramatic hormone shift a human body can experience. Estrogen and progesterone drop by over 90% in the first 48 hours after delivery.
Weeks 3-6: The wall. Sleep improved to 4.5 hours (still fragmented). Physical pain dropped to 4/10. But this is when the help disappears — meals stop arriving, visitors thin out, and the partner often returns to work. My mood data showed a dip at week 4 that was worse than week 1. I later learned this is textbook — the initial adrenaline and support network fade, and you’re left alone with the reality.
Weeks 7-12: Gradual stabilization. Sleep hit 5-6 hours (more consolidated). Physical pain dropped to 2/10. Mood stabilized but with regular dips, usually correlating with poor sleep nights and days I didn’t get outside. By week 10, I could see a genuine upward trend in my data, which was psychologically powerful — even on bad days, I could look at the chart and see that I was, objectively, doing better than I was 6 weeks ago.
FREE BONUS: The First 12 Weeks Postpartum Recovery Tracker
Daily checklist covering physical recovery, mood, sleep, and feeding for the first 12 weeks. Includes red flag symptoms that mean “call your doctor today” and a weekly self-assessment.
Get instant access → DOWNLOAD FREE
How the DDH Postpartum Dashboard Handles This
The DDH Postpartum Dashboard was the only tool I found that tracks both baby AND mother on the same screen — because they’re one system, not two.
The mother’s recovery panel tracks physical symptoms (bleeding, pain, pelvic floor status), mood (on a postpartum-specific scale, not a generic 1-10), energy levels, and sleep quality. Each entry takes under 2 minutes — critical when you’re operating on 3 hours of fragmented sleep and your working memory is roughly equivalent to a goldfish’s.
The feeding tracker covers breast, pump, bottle, and combo feeding with one-tap logging. For pumping moms, it tracks output over time so you can see production trends — and share them with a lactation consultant if supply is concerning.
The trend view is what makes tracking valuable beyond the daily log. After 2 weeks, you can see your recovery trajectory — is pain trending down? Is mood stabilizing? Are your worst days correlating with your worst sleep nights? The answers to these questions help you make informed decisions (nap when the baby naps? yes, the data literally says so) and give your OB-GYN useful information at your 6-week visit.
→ Try the DDH Postpartum Dashboard free: app.digitaldashboardhub.com/signup
Tracking Mistakes That Cost Me Months
Fertility and health tracking has a learning curve. These mistakes are more common than you’d think.
Red Flags: When to Stop Tracking and Start Calling
A tracker is not a doctor. These symptoms require immediate medical attention:
Physical red flags: Heavy bleeding (soaking a pad in less than 1 hour), blood clots larger than a golf ball, fever above 100.4 degrees F, foul-smelling discharge, severe headache that doesn’t respond to medication, vision changes, chest pain, or difficulty breathing. Any sudden change in previously improving symptoms is also a concern.
Mental health red flags: Inability to sleep even when the baby is sleeping, persistent thoughts of being a bad mother, intrusive thoughts about harming yourself or the baby, inability to eat, severe anxiety (heart racing, can’t breathe) that doesn’t improve, or feeling emotionally detached from your baby for more than 2 weeks after delivery.
I emphasize this because the tracker should help you — not replace professional care. If your data shows concerning trends, bring it to your doctor. Don’t wait for the 6-week visit. Most OBs will see you sooner if you call with specific symptoms.
What I Wish I’d Known Before Week 1
Recovery is not linear. My data showed improvement overall, but with regular dips. Day 15 was worse than day 10. Day 28 was worse than day 22. This doesn’t mean something is wrong — it means recovery fluctuates, and hormonal changes continue for months after delivery. If I’d expected a smooth upward line, I would have panicked every time it dipped.
Track for yourself, not for perfection. The point isn’t to optimize your postpartum recovery like a Silicon Valley biohacker. The point is to notice when things are off, catch warning signs early, and give your healthcare providers actual data instead of “I don’t know, I feel bad I guess?”
Your data is valid even when people dismiss it. Three times in my postpartum period, I told someone “I’m struggling” and heard “that’s normal.” Having tracked data let me say “my mood has averaged 3/10 for two consecutive weeks and is trending down.” That specificity got me taken seriously. Numbers cut through dismissal.
$1,524/yr
average amount lost to forgotten subscriptions without expense tracking
Ready? Do This
1. Right now (2 minutes): If you’re currently postpartum, rate your mood (1-10), your physical pain (1-10), and how many hours of sleep you got last night. Write it down anywhere. You just started tracking.
2. This week: Log those three numbers every day for 7 days. Add one note about your biggest challenge each day. At the end of the week, look at the pattern. Most new moms are surprised by what the data reveals — usually that certain days are consistently harder (often correlated with partner’s work schedule, visitor patterns, or hormonal fluctuations).
3. The long game: Set up the DDH Postpartum Dashboard for the full tracking experience — physical recovery, mood, feeding, and sleep in one place. Bring your 12-week report to your postpartum checkup. Your OB-GYN will thank you for the data.
Still here? You’re serious about this.
Join 200+ new moms who downloaded the 12-Week Postpartum Recovery Tracker this month. It takes 2 minutes per day and most moms say it was the first thing that made them feel in control during the fourth trimester.
Get your free copy → DOWNLOAD FREE
Keep reading (related guides):
- Free Menopause Symptom Tracker — Try It Now
- Free PCOS Symptom Tracker Dashboard — Try It Now
- Period Tracking 101: What Your Cycle Is Telling You About Your Health
- The Complete Guide to Fertility Tracking: Charts, Symptoms What Your Cycle Is Telling You
- Amazon FBA Revenue Calculator: What Sellers Actually Make in 2026
255+ interactive tools for your money, time, and health.
Full features for 14 days · Secure payment · Stop anytime
What Changed After 90 Days of Tracking
The first month of tracking best postpartum recovery tracker was frustrating. The data looked random, the patterns weren’t obvious, and I questioned whether logging this stuff daily was worth the 3 minutes it took.
Around day 35, I noticed something in my trend line that changed my approach entirely. The data showed a clear weekly rhythm I’d been completely blind to — certain days were consistently better, and the reason wasn’t random.
By month 3, I was making de
Key Takeaways
- Track one thing consistently rather than five things sporadically
- Review your data weekly — daily logging without weekly review is just data hoarding
- The best tool is the one you’ll actually open every day
cisions based on data instead of gut feelings. My results improved not because I worked harder, but because I stopped doing the things the data showed weren’t working. That’s the real value of tracking — it’s not about motivation, it’s about information. You can’t optimize what you don’t measure, and you can’t measure what you don’t track consistently.
14-Day
Free Trial
No credit card required to start
What to Read Next
- Postpartum Recovery: What to Monitor in the First 12 Weeks
- Mood Tracker: How Measuring Your Emotions Helps You Change Them
- Sleep Tracking Changed My Life: How to Fix Your Sleep
- How to Regulate Your Nervous System: 8 Steps From Stress to Calm

Andy Gaber is the founder of Digital Dashboard Hub, a suite of 255+ interactive financial, productivity, and wellness tools. He built DDH after getting frustrated with financial apps that gave outputs without context. Follow along for tool tutorials, revenue analytics breakdowns, and honest takes on personal finance.