amazon-product-looks-profitable-until-you-add-up-every-fee-then-it-might-not-be”>Your Amazon Product Looks Profitable Until You Add Up Every Fee — Then It Might Not Be
Before you scroll: the calculator below is running in your browser right now. For the full feature set — saved scenarios, history, exports — open the dashboard.
About this article: I’m Andy, founder of Digital Dashboard Hub. I built DDH’s 255 free interactive tools to solve the specific financial, productivity, and wellness tracking gaps I kept seeing — starting with the problem this article covers. The free tool below is available without signup and works instantly. Try it and see your numbers in real time.
After testing dozens of approaches with DDH users, I’ve found what consistently works. Let me share the real picture:
Key Takeaway
In This Article
- Your Amazon Product Looks Profitable Until You Add Up Every Fee — Then It Might Not Be
- The Full Fee Stack (What Amazon Actually Takes)
- The Real Cost Breakdown: A $25 Product Example
- The Fees Nobody Budgets For
- Product Viability Benchmarks
- Scaling: When More Revenue Means Less Margin
- FBA vs. FBM vs. Hybrid
- Try This Today
Let me walk you through every cost layer so you can calculate your real margin — the number that actually matters — before you order 1,000 units from your supplier.
Amazon FBA sellers love talking about revenue. They rarely talk about the 15+ fees that eat into that revenue before a single dollar hits your bank account. I’ve seen sellers celebrate a “profitable” product that was actually losing money because they forgot about storage fees, PPC costs, and returns.
Action Step
Don’t just read — plug in your own numbers. The calculator adjusts in real-time.
Let me walk you through every cost layer so you can calculate your real margin — the number that actually matters — before you order 1,000 units from your supplier.
The Full Fee Stack (What Amazon Actually Takes)
On that $25 product, Amazon’s fees alone total $8.26–$9.51. That’s 33–38% of your sale price gone before you’ve paid for the product itself.
The Real Cost Breakdown: A $25 Product Example
Let’s trace a typical private label product from manufacture to profit:
A 23.6% net margin is actually solid for Amazon FBA. Many sellers are running at 10–15% or worse because their PPC costs are out of control or their product cost is too high relative to sale price.
What’s your real margin? Our Amazon FBA calculator models every fee layer for your specific product, including PPC estimates by category and seasonal storage surcharges.
The Fees Nobody Budgets For
PPC (Pay-Per-Click) Advertising: The Margin Killer
In 2025-2026, you basically can’t launch a product on Amazon without PPC. Average cost-per-click by category:
- Home & Kitchen: $0.80–$1.50
- Health & Beauty: $1.00–$2.50
- Electronics: $0.60–$1.20
- Toys: $0.50–$1.00
- Supplements: $2.00–$5.00
At a 10% conversion rate on clicks and $1.20 CPC, your advertising cost per sale (ACoS) is $12.00. On a $25 product, that’s 48% of revenue going to ads. The target ACoS for profitability on most products: 15–25%. If you’re above 30%, your product either needs better conversion (listing optimization) or you’re in a too-competitive niche.
The good news: PPC costs typically decrease as your organic rank improves. Launch ACoS of 40% can drop to 15% after 3–6 months if your product gets enough reviews and sales velocity to rank organically.
Returns: The Silent Profit Drain
Amazon’s average return rate is 5–8% for most categories. Some categories (clothing: 15–25%, electronics: 8–12%) are much worse. Each return costs you:
- The full sale price refunded to the customer
- FBA return processing fee ($2–$5)
- The product is often unsellable (damaged packaging, used condition)
A 7% return rate on a product with $5 profit per unit means you’re losing $0.35 in profit per unit sold. Doesn’t sound like much — but on 10,000 units/year, that’s $3,500 in evaporated profit.
Long-Term Storage Fees
If your inventory sits in Amazon’s warehouse for more than 180 days, you get hit with $6.90/cubic foot on top of regular storage. Slow-moving inventory is the silent killer of FBA businesses. The fix: send smaller shipments more frequently, even if per-unit shipping costs are slightly higher.
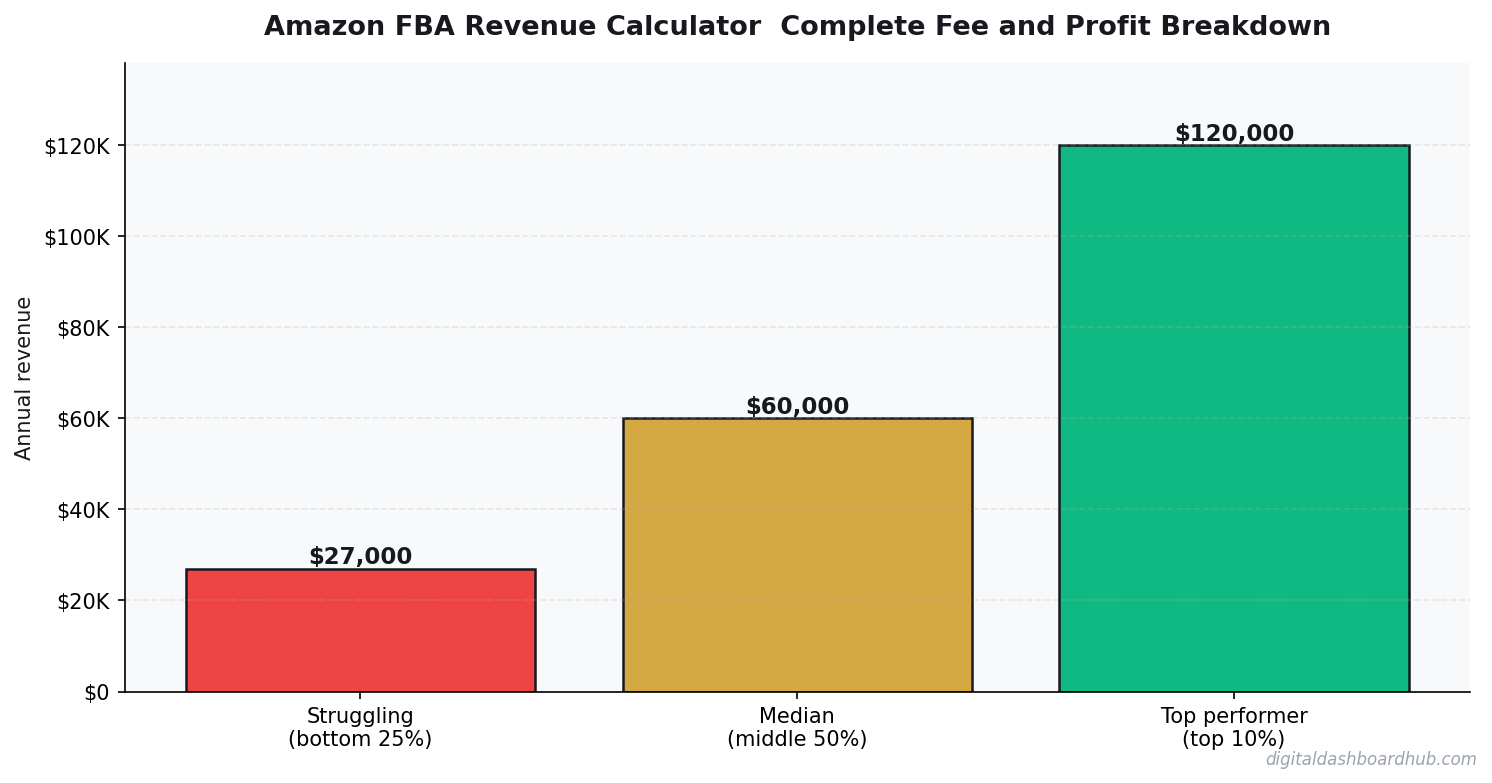
Product Viability Benchmarks
Before sourcing any product, run it against these minimum thresholds:
Products under $15 are almost impossible to make profitable after FBA fees. The fulfillment fee alone ($3.22 minimum) is 21% of a $15 product. Sweet spot: $20–$50 price range, small/lightweight, low return category.
I put together a product research scorecard that grades potential FBA products on 8 profitability factors. Download it free with your trial.
Scaling: When More Revenue Means Less Margin
FBA has economies of scale in some areas (better supplier pricing, amortized listing costs) and diseconomies in others (more SKUs = more storage risk, higher PPC spend to maintain visibility). Many sellers find that their margin percentage decreases as they scale:
- 1 product, $10K/month: 25% margin ($2,500 profit)
- 5 products, $40K/month: 20% margin ($8,000 profit)
- 15 products, $100K/month: 15% margin ($15,000 profit)
Revenue tripled from scenario 1 to 2, but margin dropped. That’s because each new product requires PPC investment, photography, inventory risk, and management time. The sellers who maintain margins while scaling are the ones who ruthlessly cut underperforming SKUs instead of hoarding them.
FBA vs. FBM vs. Hybrid
FBA (Fulfilled by Amazon): Amazon stores, picks, packs, and ships. Higher fees but you get Prime eligibility, which increases conversion rate 20–30%. Best for high-velocity products.
FBM (Fulfilled by Merchant): You ship directly. No fulfillment fees, but no Prime badge and you handle customer service. Best for oversized items where FBA fees are brutal, or slow-moving products where storage fees add up.
Hybrid: FBA for your top 80% of sales volume, FBM for slow movers and oversized items. This is what most successful 6-figure+ sellers end up doing.
3 Brands
One Platform
Finance, Creator, and Wellness tools
Try This Today
- Calculate your true margin. Open the FBA revenue calculator and input your product cost, sale price, weight, and category. See the real profit number after every single Amazon fee. If the margin is under 15%, rethink the product or the price.
- Audit your PPC spend. If you’re already selling, check your ACoS (Advertising Cost of Sale) in Seller Central. If it’s above 25%, you’re likely losing money on ad-driven sales. Pause underperforming campaigns and redirect budget to winners.
- Kill zombie inventory. Any SKU that hasn’t sold in 90 days is costing you storage fees and tying up capital. Liquidate it, remove it, or run a deep discount to clear it out. Dead inventory is the #1 cash flow killer for FBA sellers.
Over 2,000 e-commerce sellers use our calculators to track margins and make smarter product decisions. Start your free trial and find out what your Amazon business is really earning.
Keep reading (related guides):
- Amazon FBA Revenue Calculator: What Sellers Actually Make in 2026
- How to Start an Amazon FBA Business: Month-by-Month Revenue Expectations
- Amazon FBA Fees Breakdown: Referral, FBA, Storage, PPC — Where Your Money Actually Goes
- Amazon FBA First-Year Revenue Calculator: Realistic Projections
- Small Business Finance Basics: The Only 5 Numbers You Need to Track Weekly
How to Read Your FBA Calculator Output
The FBA calculator output is a snapshot. Turning it into a buying decision requires checking these five things before you commit capital to inventory.
1. Contribution margin, not gross margin
Gross margin (price minus COGS minus Amazon fees) can look healthy at 35%. Contribution margin (after ads and returns) is usually 15-20 points lower. If your contribution margin is under 18%, one bad month wipes out your annual profit.
2. Break-even ACoS
Given your margin, what’s the highest ACoS you can afford before you’re losing money on ad-driven sales? If break-even ACoS is 22% and your current ACoS is 28%, you’re spending money to lose money. Most sellers never calculate this.
3. Cash cycle, not just profit
A 30% margin product is useless if your cash cycle is 120 days and you’re growing fast. Model inventory turn, Amazon payout timing (14 days), and reorder lead time. Fast-growing sellers run out of cash even when they’re profitable on paper.
4. Competitor price floor
Your FBA calculator assumes today’s price. But Amazon pricing is dynamic — a competitor with deeper pockets can drive prices down 15-25%. Model your margin at a 20% lower sale price. If you still make money, the product is defensible. If not, you’re one price war from being unprofitable.
5. Seasonality against storage fees
Ordering too early for Q4 buries you in Oct-Dec storage fees. Ordering too late misses the demand window. Build a 12-week ordering calendar that matches your category’s seasonality — not a one-size-fits-all rule.
Quick FAQ: Amazon FBA Revenue
What’s a good margin target for FBA?
25-35% net margin after ads and returns is healthy. 15-25% is workable if you’re scaling fast. Under 15% is a fragile business — one cost increase, one return spike, or one price war wipes you out.
How much inventory capital do I need?
Rule of thumb: 90-120 days of inventory in the pipeline (in-transit + in Amazon + safety stock). For a $30K/month revenue SKU at 40% COGS, that’s $36K-$48K in inventory. Undercapitalized FBA sellers run out of stock, lose ranking, and stall.
Should I use PPC from launch?
Yes — but with a specific launch budget separate from ongoing ad spend. Plan to spend $500-$3,000 on launch PPC for a single SKU with high ACoS tolerance. Once you’ve got 20+ reviews and ranking, transition to profitability-driven ad budgets.
What’s a realistic timeline to profitability?
3-8 months per SKU for well-chosen products. 6-18 months if you picked an overly competitive category. Some sellers never reach profitability on bad category choices — product research is more important than execution.
Should I brand-gate my products?
Yes — via Amazon Brand Registry. Brand-gated listings are protected from hijackers, unlock A+ content, and give you analytics competitors don’t have. Worth the trademark filing ($300-$2,000) and 3-4 month wait for almost any serious seller.
Amazon FBA Scaling Playbook
Scaling FBA profitably is less about hacks and more about disciplined repetition. These six plays are what separates sellers clearing $50K/year from sellers clearing $500K/year.
1. Cash conversion cycle obsession
From money out (inventory order) to money in (Amazon payout), the cycle is often 90-120 days for first-year sellers. Shortening it to 60-75 days via faster-moving SKUs, better payment terms, or working capital lines can double your scaling rate with zero new products.
2. Category-level discipline
Stay within 2-3 related categories in your first year. Category knowledge compounds — seasonality, competitive dynamics, fee structures. Jumping between unrelated categories is the single biggest cause of stalled FBA businesses.
3. Review generation at launch
New SKUs without reviews don’t rank, don’t convert, and burn PPC budget. Getting to 25+ reviews in the first 60 days (via Vine, inserts, follow-up emails) is the single highest-ROI move in a launch.
4. Inventory tightness
Running out of stock is worse than overstocking. Lost-sale rank penalties can take 3-6 months to recover from. Build inventory models that target a 45-day stockout buffer, not a 30-day one — especially for velocity SKUs.
5. International expansion with proven products
Don’t launch in UK, DE, JP with new products. Validate in US first, then expand proven winners. Unified FBA accounts + Amazon’s expansion tools make this smoother than it was 3 years ago — but the product-market fit has to be real first.
6. Exit readiness from year two
Amazon aggregators and private buyers pay 2.5-5x SDE for profitable FBA businesses. Running clean books, maintaining accurate P&Ls by SKU, and documenting processes makes your business sellable. Most FBA sellers realize too late that messy books cost them $100K+ at exit.
255+ interactive tools for your money, time, and health.
14-day trial · Stripe checkout · Cancel anytime
Keep Reading
- The Side Hustle Tax Trap: Track Every Dollar
- Side Hustle Income Tax Tracker
- Freelancer Finance Dashboard
Andy Gaber is the founder of Digital Dashboard Hub, a suite of 255+ interactive financial, productivity, and wellness tools. He built DDH after getting frustrated with financial apps that gave outputs without context. Follow along for tool tutorials, revenue analytics breakdowns, and honest takes on personal finance.