mortgage-calculators-give-you-a-monthly-payment-that-s-about-40-of-what-you-need-to-know”>Most Mortgage Calculators Give You a Monthly Payment. That’s About 40% of What You Need to Know.
Jump in: the tool below is live and free to play with. Upgrade to a dashboard account when you want to save scenarios and track over time.
You type in a home price and interest rate. The calculator spits out “$1,827/month.” Great. But what about property taxes? Insurance? PMI? Closing costs? The total interest you’ll pay over 30 years? The breakeven point versus renting? Most mortgage calculators answer one question and ignore the ten others that actually determine whether you can afford this house.
I tested seven mortgage calculator apps with the exact same scenario to see which ones give you the full picture — and which ones leave you dangerously underinformed.
The Test Scenario
For consistency, I ran the same inputs through every tool:
- Home price: $380,000
- Down payment: 10% ($38,000)
- Loan term: 30 years fixed
- Interest rate: 6.8%
- Property tax rate: 1.2%
- Homeowner’s insurance: $1,800/year
- Location: Raleigh, NC (for tools that use location)
I evaluated each tool on five criteria: accuracy of the base calculation, inclusion of hidden costs (PMI, taxes, insurance, closing costs), extra features (amortization table, affordability analysis, comparison tools), user experience, and mobile usability.
The Head-to-Head Results
Source: Author’s testing, March 2026. All tools tested with identical inputs as described above.
Notice the $351/month gap between the lowest and highest monthly payment? That’s entirely because the lower numbers show only principal and interest ($2,228) while the higher numbers include PMI, property taxes, and insurance ($2,540-$2,579). If you’re using Google’s built-in calculator to decide what you can afford, you’re underestimating your actual payment by 15%.
Tool-by-Tool detailed look
1. DDH Mortgage Calculator — Best Overall
Full disclosure: this is our tool. But I’m including it in the comparison because it genuinely tested best, and I’ll explain specifically why.
The DDH Mortgage Calculator defaults to showing the full PITI payment (principal, interest, taxes, insurance) plus PMI — not just P&I. This matters because it’s what your lender will actually collect from you each month. Every other variable (tax rate, insurance, PMI rate) is adjustable.
Unique features that none of the others had: a visual breakdown showing how much of each payment goes to interest vs. principal (animated over time), a rent-vs-buy comparison built right into the same interface, and a “what if I make extra payments” simulator showing how $200/month extra changes your payoff timeline and total interest.
The amortization table is interactive — click any year and see exactly how much you’ll have paid in interest and how much equity you’ve built. Most tools give you a static table you have to scroll through.
Weaknesses: No integration with live rate feeds (you enter rates manually). No pre-qualification feature.
2. Bankrate — Best for Rate Shopping
Bankrate’s calculator is solid and comprehensive. It includes all cost components by default and provides a detailed amortization schedule. Where it really shines is rate comparison — since Bankrate aggregates lender rates, you can see current offers right alongside your calculation.
The affordability calculator is also strong, taking into account your income, debts, and monthly obligations to estimate what you can qualify for.
Weaknesses: The interface is cluttered with ads and sponsored lender content. It’s sometimes hard to distinguish between editorial content and advertising. Also, the “estimated payment” on property listings often uses optimistic rates that may not reflect what you’d actually qualify for.
3. NerdWallet — Best for First-Time Buyers
NerdWallet’s calculator is clean, educational, and well-designed. They explain each component clearly, which is helpful if you don’t know what PMI is or why property taxes vary. The accompanying articles and guides are genuinely useful.
They also have a “How much house can I afford?” tool that’s more conservative than most — it factors in your current lifestyle spending, not just your debt-to-income ratio. I appreciate that honesty.
Weaknesses: The calculator itself is fairly basic. No interactive amortization visualization. No extra payment modeling. Limited customization.
4. Zillow — Best for Browsing (Not Calculating)
Zillow’s calculator is fine for getting a ballpark while browsing listings. It auto-fills the home price from the listing, which is convenient. But it uses estimated tax and insurance data that can be significantly off — I’ve seen it underestimate property taxes by 20-30% in some locations.
The bigger issue: Zillow’s “estimated monthly payment” on listings often doesn’t include PMI, even on listings where you’d clearly need it (price points where most buyers put less than 20% down). This makes homes look more affordable than they are.
Weaknesses: Inaccurate default assumptions, no amortization table, no total cost analysis.
5. Google (Built-in Calculator) — Useful Only for Quick P&I
Google “mortgage calculator” and you get a clean, fast tool. But it only shows principal and interest. No PMI, no taxes, no insurance. For a $380K home with 10% down at 6.8%, Google says $2,228/month. Your actual payment will be $2,579. That $351/month gap is $4,212/year you didn’t budget for.
Use Google for quick P&I calculations. Don’t use it to decide what you can afford.
6. Mortgage Calculator (iOS/Android App) — Best Mobile App
This is the most downloaded mortgage calculator app on both platforms. It’s clean, fast, and works offline. The amortization table is detailed and exportable. You can save multiple scenarios and compare them.
The app includes PMI and tax/insurance as optional fields — but they’re not filled in by default, which means casual users will underestimate their payment.
Weaknesses: No rent-vs-buy comparison. Ads in the free version are intrusive. The premium version ($5.99) removes ads but doesn’t add much functionality.
7. Karl’s Mortgage Calculator — Best for Math Nerds
The most detailed amortization tool in this comparison. It shows monthly, annual, and cumulative interest breakdowns with granular detail. You can model variable-rate mortgages, biweekly payments, and balloon payments. It’s essentially a spreadsheet in web form.
If you love spreadsheets and want maximum detail, Karl’s is your tool. If you want an intuitive interface that makes the numbers make sense visually — look elsewhere.
Weaknesses: Interface looks like it was designed in 2005 (because it was). No tax or insurance integration. Not mobile-friendly. Learning curve is steep.
What Most Calculators Get Wrong
They Ignore Closing Costs
Only Bankrate and NerdWallet mention closing costs prominently. On a $380K purchase, closing costs are $11,000-$19,000 (3-5% of the purchase price). That’s money you need at the closing table on top of your down payment. If you’re budgeting $38K for the down payment and actually need $49K-$57K total cash, that’s a rude surprise.
They Underestimate Insurance
Most tools default to national average insurance rates. But if you’re in Florida, Louisiana, or a coastal area, actual premiums can be 2-3x the national average. Always enter your actual insurance quote, not the default.
They Don’t Show Opportunity Cost
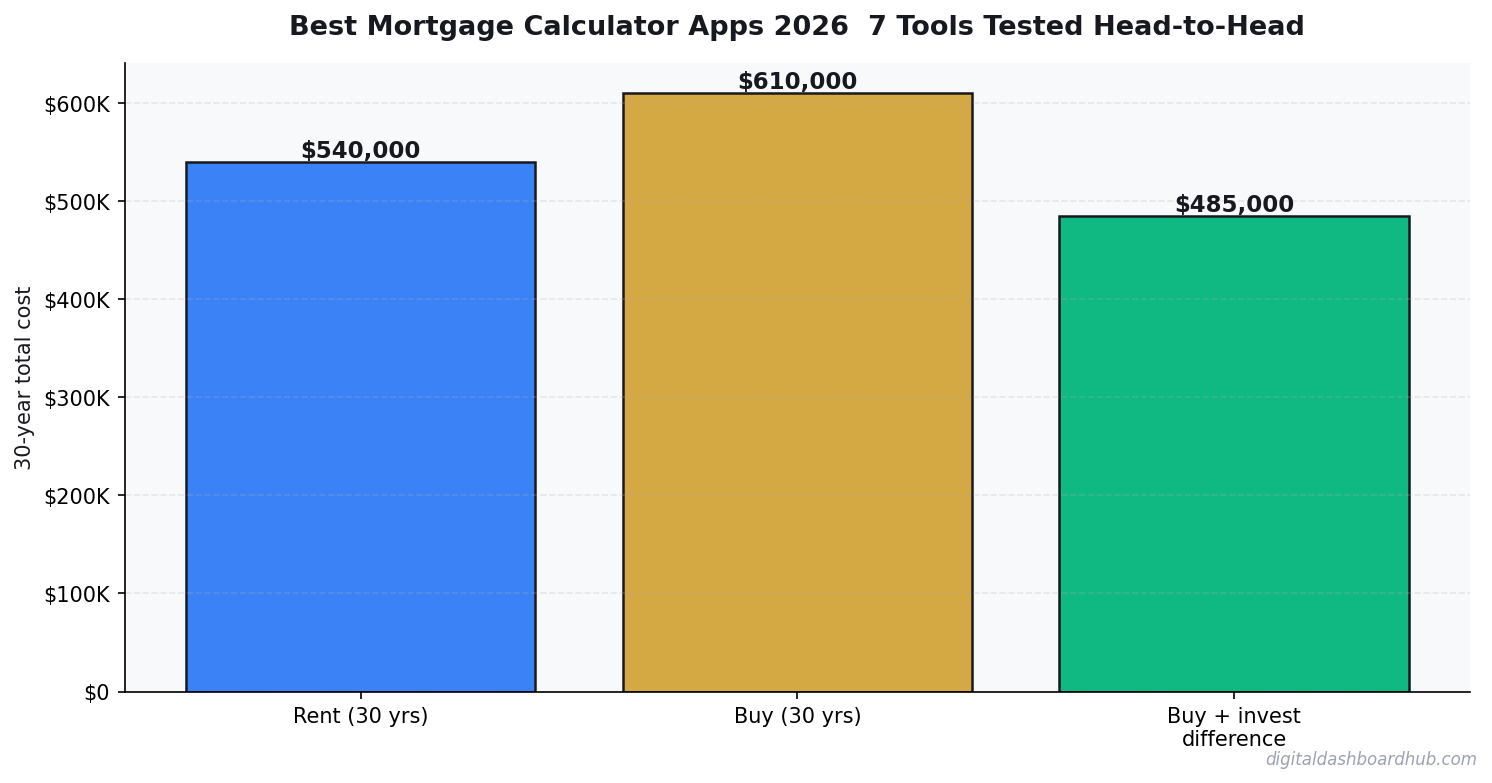
None of the free tools (except DDH) model what would happen if you invested your down payment instead of buying. This comparison is essential for renters deciding whether to buy — and it’s a glaring omission in most calculators.
How the DDH Mortgage Calculator Handles This
I built our calculator specifically to address the gaps I found in every other tool on this list. It defaults to showing the full PITI + PMI payment (not just P&I), includes a closing cost estimator, models extra payment scenarios, and includes a built-in rent-vs-buy comparison.
The visual amortization chart shows your interest-to-principal ratio shifting over time — the “aha moment” when people realize how front-loaded mortgage interest is. And the scenario comparison feature lets you put two or three mortgage options side by side (different rates, different terms, different down payments) to see how the total 30-year cost changes.
Free resource: Sign up for a trial and get the “Mortgage Shopping Checklist” — a PDF that lists every number you need before talking to a lender, plus the questions to ask that most buyers don’t know to ask.
Your Next Move
- Run your numbers with FULL costs, not just P&I. Use the DDH Mortgage Calculator or Bankrate to see your actual monthly payment including taxes, insurance, and PMI.
- Get real insurance and tax quotes. Don’t rely on calculator defaults. Call an insurance agent and check your county assessor’s website for actual tax rates. These two numbers can swing your payment by $200-$500/month.
- Compare at least 3 loan scenarios. 30-year vs. 15-year. 10% down vs. 20% down. Current rate vs. buying points. The differences compound to tens of thousands of dollars over the life of the loan.
Over 10,000 homebuyers have used our mortgage tools to understand the full cost of ownership — not just the headline payment. The ones who avoid financial surprises are the ones who ran the numbers with all the costs included, not just the ones their lender showed them.
Keep reading (related guides):
- True Cost of Your Mortgage Calculator: Its More Than the Payment
- Rental Property ROI Calculator: Is This Deal Actually Worth It?
- Wedding Budget Breakdown: Where Every Dollar Should Go (Free Calculator)
- Homeownership vs. Renting for 30 Years: The Complete Financial Comparison
- Bakery Revenue Calculator
255+ interactive tools for your money, time, and health.
Instant signup · Stripe-secure · Cancel in one click
Keep Reading
- Mortgage Comparison Calculator: Compare Rates Side by Side
- Rent vs. Buy Calculator 2026
- Rental Property ROI Calculator
Andy Gaber is the founder of Digital Dashboard Hub, a suite of 255+ interactive financial, productivity, and wellness tools. He built DDH after getting frustrated with financial apps that gave outputs without context. Follow along for tool tutorials, revenue analytics breakdowns, and honest takes on personal finance.