
Most Revenue Forecasts Are Fiction. Here’s How to Build One That Isn’t.
Before you scroll: the calculator below is running in your browser right now. For the full feature set — saved scenarios, history, exports — open the dashboard.
About this article: I’m Andy, founder of Digital Dashboard Hub. I built DDH’s 255 free interactive tools to solve the specific financial, productivity, and wellness tracking gaps I kept seeing — starting with the problem this article covers. The free tool below is available without signup and works instantly. Try it and see your numbers in real time.
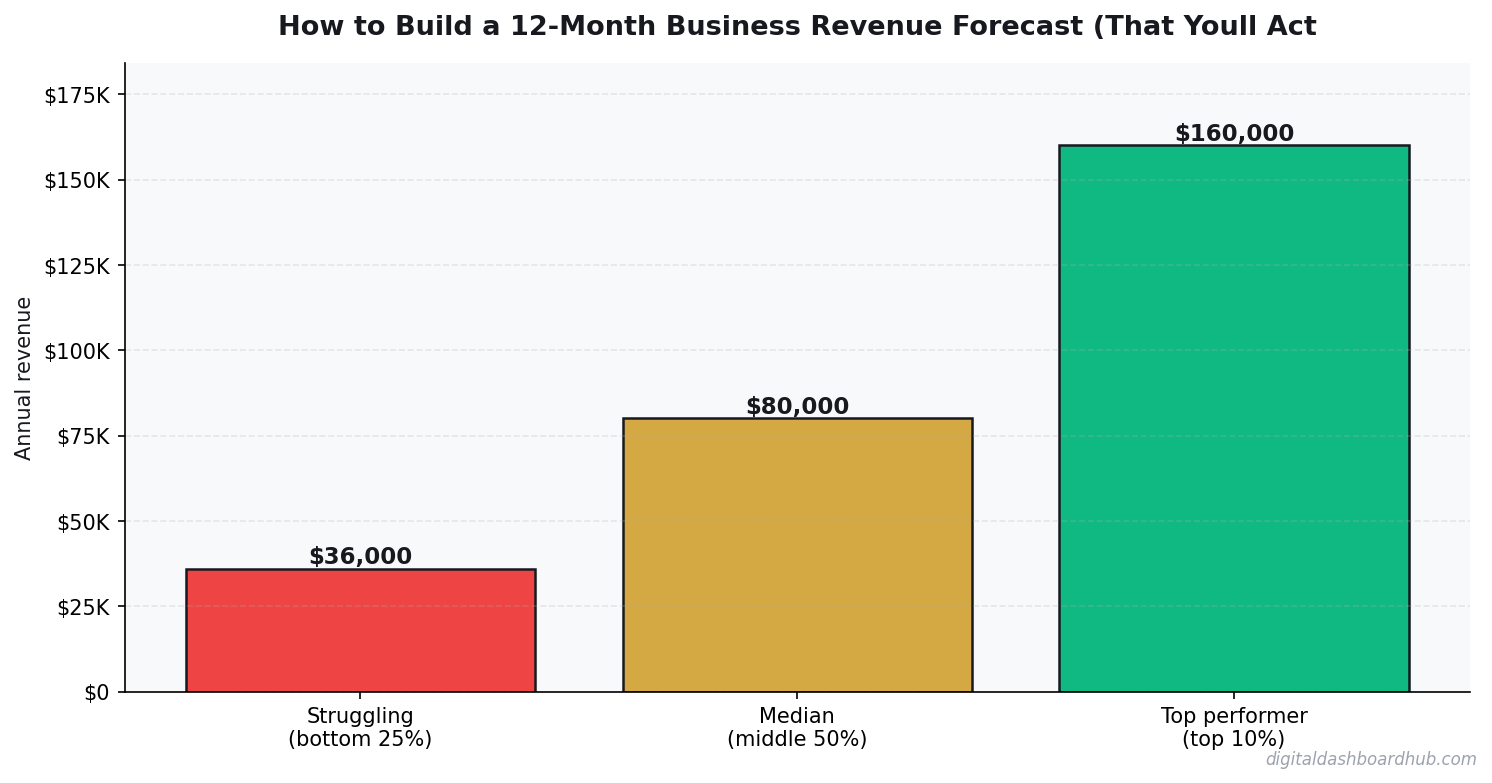
Running a SaaS business means I track these numbers obsessively. Here’s what the data actually shows:
The Takeaway
In This Article
- Most Revenue Forecasts Are Fiction. Here’s How to Build One That Isn’t.
- Step 1: Identify Your Revenue Drivers (Not Your Revenue)
- Step 2: Build the Driver-Based Model
- Step 3: Apply Seasonal Adjustments (Every Business Has Them)
- Step 4: Create Three Scenarios (Not One)
- How the DDH Business Revenue Forecast Calculator Handles This
- Step 5: The Expense Side — Don’t Forget It
- Step 6: The Monthly Review Ritual (5 Minutes That Save Your Business)
- Common Mistakes That Kill Forecast Accuracy
- A Real Example: How Forecasting Saved a Decision
- Start Here
- You Might Also Like
Most people start their forecast with a revenue number: “I want to make $15,000/month.” Then they work backward to justify it. This is how you build fiction.
I’ve reviewed over 50 small business revenue forecasts as an advisor, and roughly 80% of them are fantasy documents. They show a nice upward curve, they feel optimistic, and they’re wrong by 40-60% within three months. Not because the business owners are dumb — because they skipped the steps that make forecasts reliable.
Reality Check
Most online calculators oversimplify. This one includes variables that actually affect your outcome.
A good revenue forecast isn’t a wish list. It’s a math model built on specific inputs you can track and adjust. This guide walks through the exact process I use to build forecasts that are typically accurate within 10-15% — close enough to make real decisions on hiring, inventory, marketing spend, and cash reserves.
Step 1: Identify Your Revenue Drivers (Not Your Revenue)
Most people start their forecast with a revenue number: “I want to make $15,000/month.” Then they work backward to justify it. This is how you build fiction.
Instead, start with your revenue drivers — the specific inputs that create revenue. For a service business, your drivers are: number of clients, average transaction value, and purchase frequency. For a product business: traffic, conversion rate, average order value, and repeat purchase rate.
Here’s the difference in practice:
Bad forecast: “Revenue will be $15,000 in month 1, growing 10% monthly.” (Says who? Based on what?)
Good forecast: “I’ll have 12 clients paying an average of $180/visit, coming twice per month. 12 × $180 × 2 = $4,320. I’ll add 3 new clients per month based on my current ad spend producing 8 leads/month at a 38% close rate.” (Every number is trackable and adjustable.)
The good forecast will be wrong too — but when it’s wrong, you’ll know exactly which driver was off. Was it the lead count? The close rate? The visit frequency? You can fix specific inputs. You can’t fix “revenue was lower than expected.”
Step 2: Build the Driver-Based Model
Here’s a template structure that works for most small businesses. I’ll use a hypothetical dog grooming business as the example.
Notice how every revenue number is calculated from drivers, not guessed. If month 3 revenue comes in at $2,100 instead of $2,475, you check: did I get fewer new clients than expected? Is my ticket size lower? Is churn higher? The model tells you exactly where to look.
Step 3: Apply Seasonal Adjustments (Every Business Has Them)
“My business isn’t seasonal.” Yes it is. Even businesses that seem steady year-round have patterns. B2B services slow in December and August (holidays and vacations). Fitness businesses spike in January and drop in summer. Retail peaks in November-December. Home services slow in winter (except HVAC and plumbing).
The fix: apply a seasonal adjustment factor to each month based on your industry’s known patterns. If your industry typically does 80% of average revenue in January and 120% in October, multiply your base forecast by those percentages.
Where to find seasonal data for your industry: your own historical data (best source), industry association reports, Google Trends for your primary keyword (shows search demand seasonality), or ask 3-4 competitors/peers about their slow and busy months.
A forecast without seasonal adjustments is a forecast that will be embarrassingly wrong in your slow months and unexpectedly optimistic in your peak months. Both are bad for decision-making.
Step 4: Create Three Scenarios (Not One)
A single-number forecast gives you false precision. You don’t know the future — but you can bracket it. Build three scenarios:
Conservative (80% probability): Your drivers perform 20% below your best estimate. Fewer new clients, lower ticket, higher churn. This is the scenario you use for cash reserve planning and break-even analysis. If you can survive the conservative scenario, you’re financially safe.
Base case (50% probability): Your best estimate of each driver. This is the scenario you use for hiring decisions and marketing budget planning.
Optimistic (20% probability): Your drivers perform 20% above your best estimate. More clients, higher ticket, lower churn. This is the scenario you use for capacity planning — making sure you can handle the upside without turning away business.
The range between conservative and optimistic ($52K-$79K) is your planning range. Every financial decision should work in the conservative scenario. Every growth decision should be tested against the optimistic scenario (can you handle the demand?).
How the DDH Business Revenue Forecast Calculator Handles This
Building this model in a spreadsheet works, but it’s tedious and error-prone. The DDH Revenue Forecast Calculator automates the entire framework described above.
You input your revenue drivers (clients, pricing, frequency, churn rate, growth rate), select your industry for seasonal adjustment presets, and it generates all three scenarios automatically. The monthly cash flow view shows your revenue alongside your fixed costs so you can see exactly when you cross into profitability — and whether you have enough runway to get there.
The “what-if” feature lets you change one driver at a time and see the ripple effect. What if I raise prices by $10? What if churn drops from 6% to 4%? What if I increase ad spend to get 2 more clients per month? Each change updates the 12-month projection instantly, showing you which drivers have the biggest impact on your bottom line.
Most business owners discover that reducing churn by 2% has a bigger revenue impact than adding 3 new clients per month. That’s the kind of insight a good model reveals — and it changes where you invest your time and money.
Step 5: The Expense Side — Don’t Forget It
Revenue is only half the forecast. You need to model expenses with the same rigor. Separate your costs into three buckets:
Fixed costs: Rent, insurance, software subscriptions, loan payments. These don’t change with revenue. They’re the easiest to predict and the hardest to cut.
Variable costs: Supplies, payment processing fees, contractor labor, shipping. These scale with revenue. Express them as a percentage of revenue rather than a fixed dollar amount.
Discretionary costs: Marketing, tools, training, travel. These are optional — you choose to spend them. They should be the first to cut if the conservative scenario plays out, and the first to increase if the optimistic scenario materializes.
Your monthly profit = revenue – fixed costs – variable costs – discretionary costs. Track this monthly and compare to forecast. If profit is below the conservative scenario for two consecutive months, you have a problem that needs immediate attention.
Step 6: The Monthly Review Ritual (5 Minutes That Save Your Business)
A forecast that sits in a drawer is useless. The entire value of forecasting is the monthly comparison between what you predicted and what actually happened.
On the first of every month, spend 5 minutes on this:
Compare actual revenue to base case forecast. Are you above or below? By how much?
Identify which driver was off. Check each driver (clients, ticket size, frequency, churn) against your assumption. One will be the culprit — usually client acquisition or churn.
Adjust the remaining months. If you’re trending below base case, shift your planning to the conservative scenario. If you’re trending above, shift to optimistic. This is a 2-minute exercise that keeps your decisions aligned with reality.
The businesses that do this monthly review consistently are the ones that catch problems early — before a cash flow crisis forces painful decisions. The ones that skip it get blindsided by a slow quarter they should have seen coming.
Common Mistakes That Kill Forecast Accuracy
Mistake 1: Linear growth assumptions. “I’ll add 5 clients per month, every month, for 12 months.” In reality, client acquisition is lumpy. Some months you get 8, some months you get 1. And as your client base grows, maintaining the same acquisition rate gets harder. Model a tapering growth rate, not a straight line.
Mistake 2: Ignoring churn. If you acquire 5 clients per month but lose 2, your net growth is 3. Many forecasts count new clients but forget that existing clients leave. Even low churn (3-5% monthly) compounds into significant revenue loss over 12 months.
Mistake 3: Forecasting revenue without forecasting capacity. Your month 8 forecast shows $12,000 in revenue. Can you actually deliver $12,000 worth of service at that point? Do you have enough hours, staff, inventory, or production capacity? Revenue you can’t fulfill is revenue you don’t earn — and customers you lose permanently.
Mistake 4: One-time revenue treated as recurring. That $3,000 project in month 4 is great — but if it’s not repeatable, don’t extrapolate it. Separate one-time revenue from recurring revenue in your model. Your financial safety depends on the recurring number.
A Real Example: How Forecasting Saved a Decision
A cleaning business owner I advised was considering hiring a second employee in month 4 at $2,800/month in payroll costs. Her base case forecast showed $7,200/month revenue at that point — easily covering the hire.
But when we ran the conservative scenario, month 4 revenue was $5,400. After fixed costs ($1,800) and the new hire ($2,800), she’d have $800/month left — no margin for error. We adjusted the hiring trigger: wait until actual revenue hits $8,000/month for two consecutive months, then hire. She hit that threshold in month 6 instead of month 4, hired with confidence, and never stressed about making payroll.
That’s what forecasting does. It turns gut-feel decisions into data-driven ones. Not perfect — but dramatically better than guessing.
Start Here
Step 1: List your 3-4 revenue drivers. For each one, write down your current actual number and your best estimate for 12 months from now. That’s your driver trajectory.
Step 2: Apply a seasonal adjustment to your monthly forecast. If you don’t have your own historical data, use Google Trends for your industry keyword to see the seasonal search pattern — it’s a reasonable proxy for demand.
Step 3: Build your three-scenario forecast in the DDH Revenue Forecast Calculator to see your monthly cash flow, break-even month, and the driver changes that would have the biggest impact on your annual revenue.
14-Day
Free Trial
No credit card required to start
You Might Also Like
- Freelancer Finance Dashboard
- Side Hustle Tax Trap: Track Every Dollar
- How Sinking Funds Saved Me From Financial Emergencies
Keep reading (related guides):
- Auto Mechanic Revenue: What Owners Make vs. What Youd Expect (2026)
- Boutique Revenue Calculator
- Sales Funnel Conversion Optimizer: Find the Leak Thats Costing You Sales
- Massage Therapist Revenue Calculator: What Youll Actually Take Home in 2026
- How Journaling Rewires an Anxious Brain: A Science-Backed Guide
255+ interactive tools for your money, time, and health.
14-day trial · Stripe checkout · Cancel anytime
Andy Gaber is the founder of Digital Dashboard Hub, a suite of 255+ interactive financial, productivity, and wellness tools. He built DDH after getting frustrated with financial apps that gave outputs without context. Follow along for tool tutorials, revenue analytics breakdowns, and honest takes on personal finance.