Not all insurance agent businesses are created equal. The ones making $200K+ per year aren’t working some secret playbook — they just have better numbers on 3-4 key metrics. This calculator shows you exactly which metrics move the needle most.
Use the Free Insurance Agent Tool
Scroll down — the interactive tool runs live with your inputs. Full version lives inside Digital Dashboard Hub. Two-click trial, Stripe-secure.
I launched Digital Dashboard Hub because the tools I found online were either too generic or too complicated. Here’s the honest breakdown:
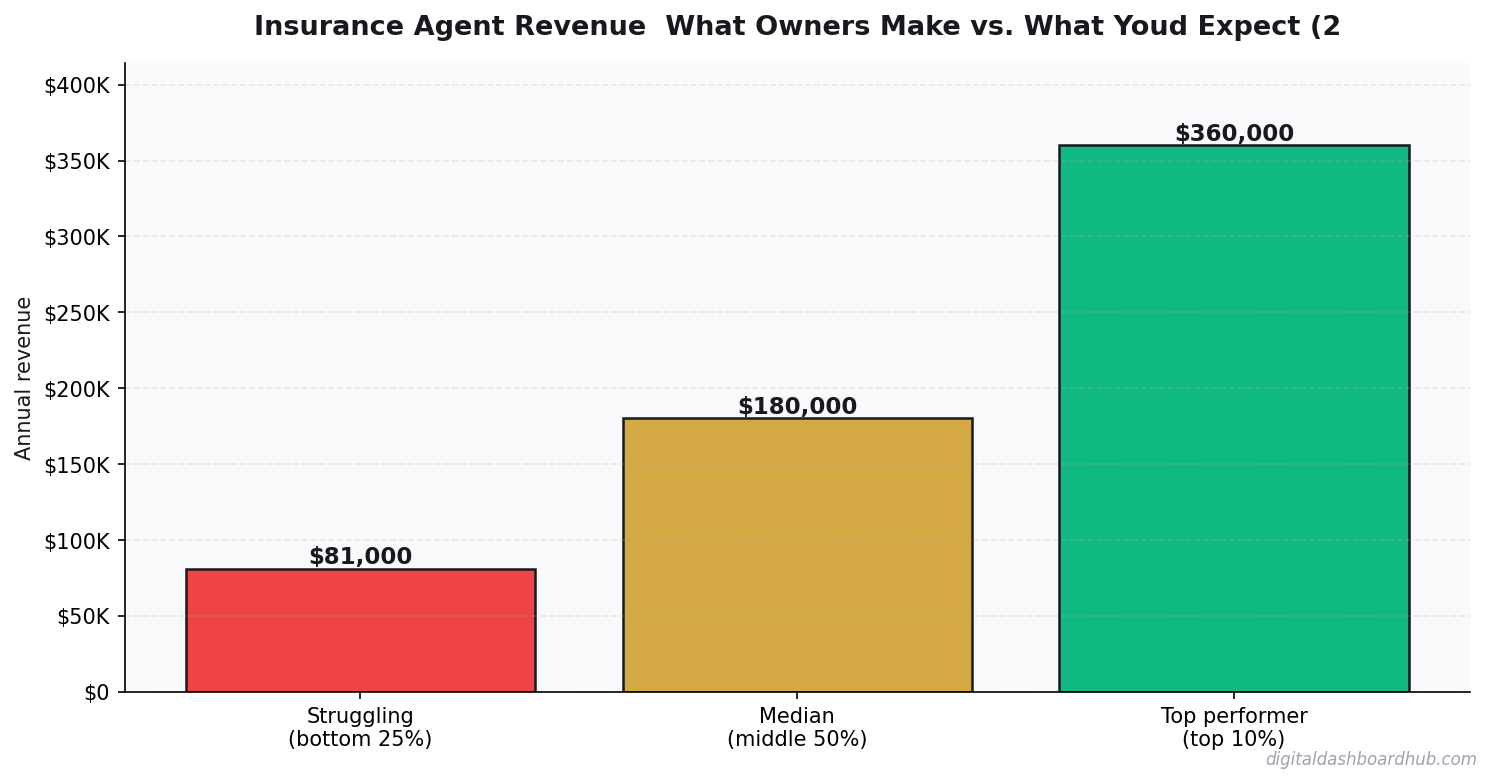
What Insurance Agent Owners Actually Take Home
A solo insurance agent typically earns $60K-$120K/year. An agency owner with 3-5 producers can hit $300K-$500K gross, but producer commissions (40-60% of premium), E&O insurance ($2K-$5K/year), and lead gen costs shrink net to 25-35%.
Retention rate is everything. A book of business with 90% retention generates 3x the lifetime revenue of one at 80%. That 10% gap is enormous over 5 years.
Breaking Down the Real Costs
| Approach | Startup Cost | Time Investment | Revenue Potential | Best For |
|---|---|---|---|---|
| Solo operator | Low ($1K-$10K) | Full time | $60K-$200K/yr | Maximum margins, full control |
| Small team (2-5) | Medium ($10K-$50K) | Management + some fieldwork | $200K-$800K/yr | Scaling without losing control |
| DDH Revenue Tracker | Free trial | 5 min setup | N/A (profit tool) | Know your real numbers in real time |
The biggest line item? The real cost isn’t overhead — it’s time. the average policy takes 4-6 hours of quoting, follow-up, and paperwork before you see a dime.
Cross-selling existing clients is 5-7x cheaper than acquiring new ones. Every client should have at least 2 policies with you — auto + home, or business + workers comp.
Where Most Businesses Leak Money
Chasing new policies instead of building renewal income. Year 1 commissions barely cover acquisition costs. The profit is in years 2-10 of renewals.
Auto renewals spike in spring, home policies in summer. Q4 is Medicare open enrollment — agencies that don’t capture this leave 20% of potential revenue on the table.
What the Full Dashboard Looks Like
How to Use This Calculator
Start by entering your actual numbers — not estimates. Pull from your bank statements, your POS system, or your accounting software. The difference between estimated and real inputs is usually the difference between “this looks fine” and “oh, that’s where the money is going.”
Then change one variable at a time. For insurance agent, the lever that usually moves the needle most is cross-selling existing clients is 5-7x cheaper than acquiring new ones. Start there.
If you want to save these projections, track them month-over-month, or model different scenarios side by side, the full dashboard does all of that. Free 14-day trial, no credit card required.
Your Next Move
Related Tools and Articles
- The True Cost of a Mortgage vs. The True Cost of Renting: A 30-Year Analysis
- Small Business Finance Basics: The Only 5 Numbers You Need to Track Weekly
- Mood Tracker: How Measuring Your Emotions Helps You Actually Change Them
Common Questions About Insurance Agent Revenue: What Owners Make vs. What You’d Expect (2026)
How long does it take to see results?
Most people see meaningful progress within 30-90 days when they apply these strategies consistently. The key is tracking your numbers from day one so you have a baseline to measure against.
What’s the biggest mistake people make?
Trying to do everything at once. Pick one or two strategies from this guide, implement them fully, then layer in additional tactics. Spreading yourself thin is the fastest way to see no results from any of it.
Do I need special tools or software?
Not necessarily to start — but the right tools eliminate hours of manual work. Our free calculators and trackers at Digital Dashboard Hub are a good starting point before you invest in paid software.
What Insurance Agents Actually Net — Worked Example
A real number breakdown for an independent P&C agent in their third year, when most agents hit their stride.
Book of business: 320 active clients, average annual premium $1,400. Total premium volume: $448,000. Commission at 10% renewals / 12% new business, assuming 70% renewals: ~$47,488 gross commission. After expenses (E&O insurance, licensing, CRM, office): roughly $5,800/year. Net income: ~$41,700/year at year 3.
That grows substantially as the book scales. A 600-client book at similar averages generates $85,000-95,000/year in net commission for an efficient solo agent — income that’s largely recurring and requires less sales work each year as renewals dominate.
What Owners Make vs. What You’d Expect
The surprise for most new agents: it takes 3-5 years to build enough of a renewals base to have real income stability. Year one is brutal — you’re selling constantly and the renewal base barely exists. Year one income for most independent agents: $18,000-28,000 gross.
The second surprise: your highest-margin product is rarely the most popular one. Life insurance pays 50-90% first-year commission but is a harder sale. P&C auto pays 10-15% but almost sells itself. The agents who build wealth layer life, disability, and commercial onto a P&C base — not as upsells, but as genuine client service that also pays better.
Why Insurance Agent Income Is More Predictable Than Most People Think
Residual commissions are the engine behind insurance income that most outsiders don’t understand. On a life insurance policy you sell once, you collect renewal commissions every year the client keeps the policy. An agent who’s been building for 5+ years is often collecting $40,000–$80,000 annually just from renewals — before writing a single new policy that year.
P&C (property and casualty) agents running their own book of 500–800 households typically see 80–90% retention year over year. At $900 average annual premium per household and 10–15% commission, that’s a recurring base of $40,000–$108,000 before new business. This is why established P&C agencies sell for 1.5–2.5x annual commissions — the book is a real asset.
The income ceiling for a solo agent is usually $180,000–$250,000 net. Beyond that, you need to hire producers or move into managing an agency. Producers typically split commissions 40–60% with the agency, so a high-volume producer adds meaningful revenue without the owner working more hours.
The Costs of Running an Insurance Agency That Eat Into Your Margin
E&O (errors and omissions) insurance is non-negotiable and not cheap — $1,500–$4,000/year for a solo agent depending on volume and lines. State licensing fees, CE requirements, carrier appointment costs, and association dues stack up to $3,000–$6,000/year in fixed overhead before you touch software or marketing.
Lead acquisition is the variable cost that kills new agents. Buying leads at $15–$40 each with a 5–8% close rate means a cost per acquired client of $200–$800 before time is factored in. The agents growing fastest are investing in referral networks — partnering with mortgage brokers, real estate agents, and car dealerships — where lead costs drop to near zero.
The math on hiring support staff is often misunderstood. A $45,000/year CSR who handles renewals, certificates, and billing frees the agent to write 30–40% more new business. If new business averages $1,200/year in commission per client, freeing up time to write 20 more clients/year pays for the hire twice over.
Churn Rates: What’s Normal and What’s a Crisis
Churn benchmarks vary massively by business type, and most founders compare themselves to the wrong cohort. Here’s a realistic breakdown:
For B2C SaaS priced under $30/month, 5–8% monthly churn is common and not necessarily catastrophic — but it means you’re replacing half your customer base every year. B2B SaaS should target under 2% monthly churn; anything above 3% indicates a product-market fit problem, not a marketing problem. E-commerce subscription boxes average 10–15% monthly churn because novelty wears off fast.
The churn number that matters most is revenue churn, not customer churn. Losing 10 customers who each paid $10/month is a very different problem than losing 2 customers who each paid $500/month. Always calculate both, and track whether your churning customers skew toward your lowest-tier or highest-tier plans — that tells you where the product is failing.
Keep reading (related guides):
- Auto Mechanic Revenue: What Owners Make vs. What Youd Expect (2026)
- Boutique Revenue Calculator
- Spray Tan Revenue Calculator: Appointments, Pricing, and Take-Home Pay
- Pet Business Revenue Calculator: Grooming, Boarding, or Training?
- Debt Snowball vs Avalanche Calculator: Which Method Saves You More Money
255+ interactive tools for your money, time, and health.
14 days free · No charge today · 2-click cancel
What Most People Get Wrong
The single biggest mistake is treating revenue as the headline number. Revenue is vanity — margin is sanity, and cash-in-bank is reality. Two operators with identical top-lines routinely end the year $80K apart in take-home, because one priced for volume and the other priced for sustainability. The calculator above forces you to surface that gap before it hits your bank account.
The second mistake is modeling a “best case” and planning around it. The number you should plan around is the 30th-percentile scenario — enough demand to matter, but slower than you hoped. If the business still covers your living expenses there, you have real margin of safety. If it only works in the 80th-percentile case, you are building on sand.
The third mistake is ignoring your time as a cost. If you would otherwise earn $55/hr at a day job and this operation pays you effectively $18/hr for 60-hour weeks, the gap is the real price of running it. Plug your opportunity cost into the calculator and the picture often flips.
How to Pressure-Test Your Numbers
Start with the calculator, then stress-test three levers independently:
- Pricing: What happens to your take-home if you raise prices 10%, but lose 15% of volume? Most operators are surprised to find net income goes up.
- Costs: What happens if your largest input cost rises 20%? This is not hypothetical — it is a typical 12-month swing in most industries.
- Volume: What happens at 70% of your planned volume for 90 days? If that still covers fixed costs, you have a real business. If not, the model is fragile.
Running the calculator three ways takes about ten minutes. The clarity on the other side of those ten minutes is usually the difference between a confident operating plan and guessing for another six months.
Frequently Asked Questions
How accurate is this calculator?
The underlying math uses industry-standard margin and cost ranges sourced from the Insurance Agent Revenue: What Owners Make vs. What You’d Expect space. Your actual numbers depend on location, seasonality, and operating style, so treat this as a directional benchmark, not a guarantee. The more precisely you enter your inputs, the tighter the output range becomes.
Can I save my results?
A free Digital Dashboard Hub account saves every scenario you run, lets you compare side-by-side, and unlocks the full dashboard with expense tracking and month-over-month charts. The 14-day trial includes the complete tool library — no credit card required to start.
Who is this tool for?
It’s built for anyone pressure-testing a real decision — existing operators auditing their margins, side-hustlers deciding whether to go full-time, and prospective owners trying to sanity-check a business plan before signing a lease. You do not need any accounting background to use it.
What should I do with the results?
Start by comparing the output against your current (or projected) monthly take-home. If the gap is big, walk back the inputs and identify which lever — pricing, volume, or cost structure — is doing the damage. That is usually where the highest-leverage fix lives.
The Bottom Line
Most operators lose money not because the math is impossible, but because they never actually ran it. Fifteen minutes with the calculator beats three months of guessing. Run your numbers, screenshot the output, and use it as the baseline for every pricing and cost decision over the next quarter.
When you are ready to go deeper, the full Digital Dashboard Hub workspace lets you save scenarios, track actuals month-over-month, and see the trend before problems compound. That is the version that actually compounds the effort — spreadsheets forgotten in a Google Drive folder do not.
Next Steps
- Run the calculator above with your best current estimates.
- Re-run it with a pessimistic scenario (lower volume, higher costs) and a stretch scenario (better pricing, more efficient ops).
- Screenshot all three outputs so you have a baseline to compare against when reality arrives.
- Revisit monthly — the number that matters is the one that changes with your real P&L.
Ready for the full dashboard?
Unlock all 255 tools across business, creator, and health workflows.
Andy Gaber is the founder of Digital Dashboard Hub, a suite of 255+ interactive financial, productivity, and wellness tools. He built DDH after getting frustrated with financial apps that gave outputs without context. Follow along for tool tutorials, revenue analytics breakdowns, and honest takes on personal finance.