The “Always Buy” Advice Doesn’t Work in Every ZIP Code
Running a SaaS business means I track these numbers obsessively. Here’s what the data actually shows:
Your parents told you renting is throwing money away. Your landlord just raised your rent 8%. Your coworker brags about their equity. But at 6.5-7% mortgage rates, the math has fundamentally shifted in many markets. In some states, buying is still a clear win. In others, you’ll pay more per month to own and wait 7-10 years just to break even against renting. The answer depends entirely on where you live.
I ran the numbers for all 50 states using 2026 median home prices, current mortgage rates, and average rents. Some results will confirm what you expected. Others will surprise you.
Where Buying Beats Renting in 2026
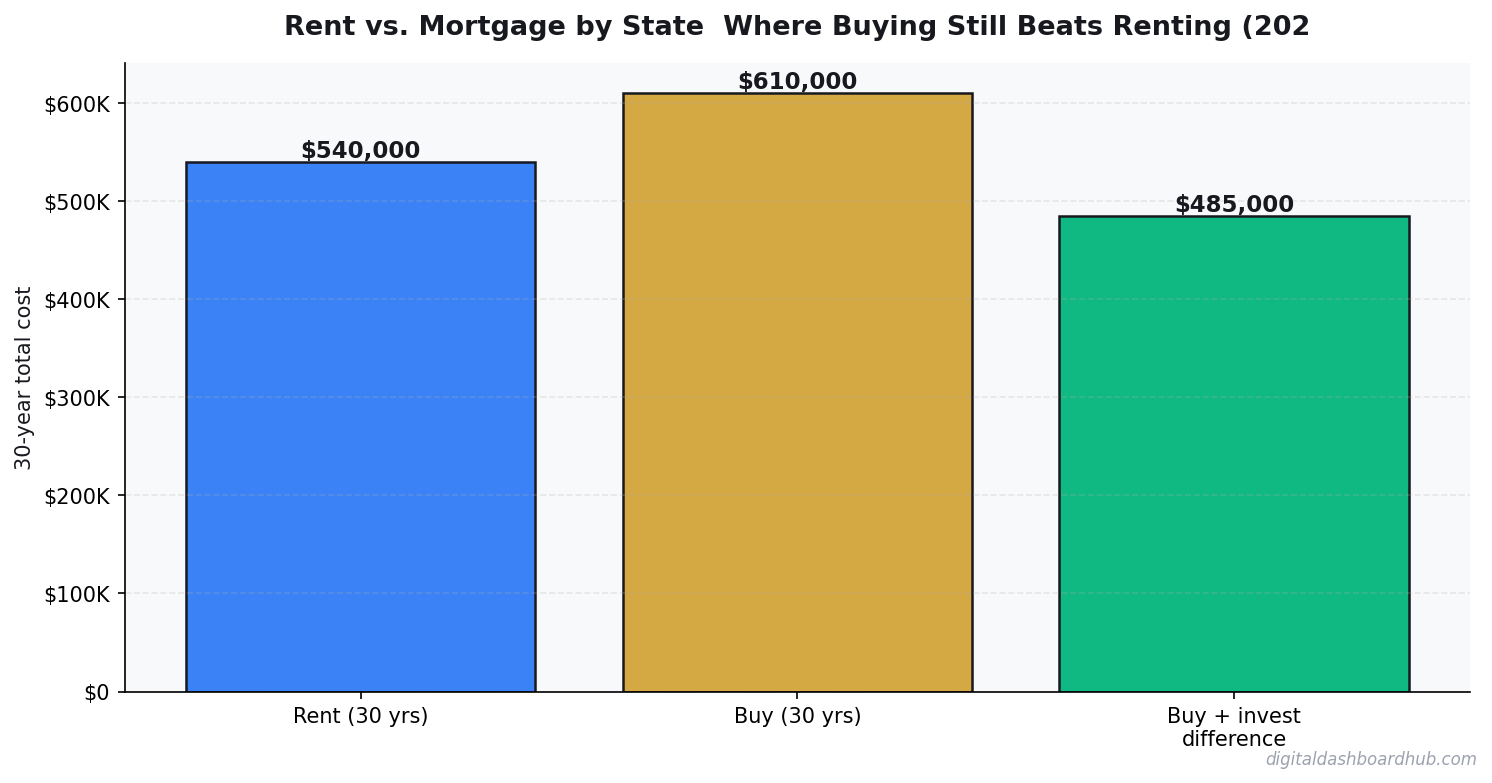
To compare fairly, I calculated the monthly cost of ownership (mortgage P&I + taxes + insurance + maintenance) versus median rent for a comparable home, then factored in equity building and typical appreciation rates.
*Monthly cost to own includes P&I at 6.75%, 20% down, property tax, insurance, and 1% maintenance. **NY excludes NYC metro.
The States Where Buying Is a No-Brainer
In the Midwest and parts of the Southeast, homeownership math still works at current rates. States like Ohio, Indiana, Michigan, Alabama, and Kentucky have median home prices low enough that monthly ownership costs are within $300-$500 of rent — and you’re building equity from day one.
The key metric: break-even period. That’s how long you need to own before buying beats renting financially (accounting for closing costs, equity, appreciation, and the opportunity cost of your down payment). Under 5 years = buying wins. Over 7 years = you’d better be sure you’re staying put.
The States Where Renting Makes More Sense
California, Hawaii, Washington, Oregon, and parts of the Northeast have break-even periods over 7 years. When your monthly ownership cost is 2x your rent, the “renting is throwing money away” argument falls apart. You’d build more wealth renting cheaply and investing the difference in index funds.
The Texas Trap
Texas looks affordable on the sticker price, but property taxes average 1.8% — nearly double the national average of 1.1%. On a $305,000 home, that’s $5,490/year ($457/month) in property tax alone. Combined with no state income tax (which means the state gets its revenue from property taxes), the true monthly cost in Texas is higher than many people realize. Always include property tax rates in your state comparison.
The Florida Insurance Crisis
Florida home prices look reasonable, but homeowners insurance has tripled in many counties since 2021. Average annual premiums are $4,000-$8,000 depending on flood zone, and some insurers have pulled out of the state entirely. Factor $500-$700/month for insurance before deciding Florida is affordable.
Get the exact numbers for your state and price range. Our rent vs. mortgage calculator uses your specific state’s property tax rate, insurance averages, and appreciation data — not national averages that could be off by thousands.
The 5 Factors That Actually Decide It
- How long you’ll stay: Under 5 years? Almost always rent. Closing costs alone (3-6% of purchase price) take years to recoup.
- Local appreciation rate: A market appreciating at 5%/year changes the math dramatically vs. one at 2%.
- Your opportunity cost: That $70K down payment invested at 8% grows to $150K in 10 years. The house has to beat that.
- Property tax rate: Ranges from 0.28% (Hawaii) to 2.49% (New Jersey). This swings monthly costs by hundreds of dollars.
- Rent trajectory: If rents are rising 5-8% annually in your area, buying locks in your housing cost (minus taxes and insurance increases).
Where to Go From Here
- Right now: Look up your state’s median home price, average rent, and property tax rate. Calculate whether buying or renting puts more cash in your pocket each month.
- This week: Use a state-specific rent vs. mortgage calculator to find your personal break-even timeline. The generic “5-year rule” doesn’t apply equally everywhere.
- Long game: If you decide to buy, aim for a market with sub-5-year break-even and plan to stay at least that long. If you rent, invest the difference monthly — that’s the key to making renting actually beat buying.
Over 1,500 people have compared rent vs. mortgage in their state using our tools. The right answer is different for everyone — but it’s always a math problem, not a feelings problem. Run your comparison free.
The States Where the Math Has Actually Flipped
Three years ago, buying was a clear win in most Sun Belt markets. At 7%+ mortgage rates, that calculus has changed sharply. Let me show you a real comparison from two contrasting markets in 2026.
Austin, TX: Median home price $465,000. At 20% down and 7.1% rate, your P&I payment is $2,501/mo. Add taxes ($625/mo), insurance ($175/mo), and HOA ($200/mo) and you’re at $3,501/mo to own. Comparable rental in the same zip: $2,400/mo. Renting saves $1,100/mo in Austin right now. That’s $13,200/year — not counting maintenance and opportunity cost on that $93K down payment.
Cleveland, OH: Median home price $165,000. At 20% down and 7.1%, P&I is $888/mo. With taxes ($175/mo) and insurance ($85/mo), total: $1,148/mo. Comparable rental: $1,300/mo. Buying saves $152/mo in Cleveland — and you’re building equity on a property likely to appreciate steadily in a supply-constrained market.
The Break-Even Math Most People Skip
The real rent vs. buy question isn’t monthly cost — it’s break-even horizon. It typically takes 5-7 years for buying to beat renting after you account for transaction costs (realtor fees, closing costs, title insurance). That’s $25,000-$40,000 in friction on a typical purchase.
If you’re not staying 5+ years, the numbers almost always favor renting — even in markets where monthly costs look similar. This is the insight most homebuying calculators bury in footnotes.
What the Calculators Miss
Most rent vs. buy tools ignore the opportunity cost of the down payment. A $75,000 down payment invested in index funds at historical returns (7% real) becomes $105,000 in 5 years. That’s $30,000 in foregone investment growth that needs to be subtracted from the “equity you built” column before you declare buying the winner.
Keep reading (related guides):
- True Cost of Your Mortgage Calculator: Its More Than the Payment
- Rental Property ROI Calculator: Is This Deal Actually Worth It?
- Wedding Budget Breakdown: Where Every Dollar Should Go (Free Calculator)
- Homeownership vs. Renting for 30 Years: The Complete Financial Comparison
- Bakery Revenue Calculator
255+ interactive tools for your money, time, and health.
Full features for 14 days · Secure payment · Stop anytime
Keep Reading
- Rent vs. Buy Calculator 2026
- Mortgage Comparison Calculator: Compare Rates
- Rental Property ROI Calculator
Common Questions About Rent vs. Mortgage by State: Where Buying Still Beats Renting (2026)
How long does it take to see results?
Most people see meaningful progress within 30-90 days when they apply these strategies consistently. The key is tracking your numbers from day one so you have a baseline to measure against.
What’s the biggest mistake people make?
Trying to do everything at once. Pick one or two strategies from this guide, implement them fully, then layer in additional tactics. Spreading yourself thin is the fastest way to see no results from any of it.
Do I need special tools or software?
Not necessarily to start — but the right tools eliminate hours of manual work. Our free calculators and trackers at Digital Dashboard Hub are a good starting point before you invest in paid software.
Andy Gaber is the founder of Digital Dashboard Hub, a suite of 255+ interactive financial, productivity, and wellness tools. He built DDH after getting frustrated with financial apps that gave outputs without context. Follow along for tool tutorials, revenue analytics breakdowns, and honest takes on personal finance.