
You’re thinking about starting a roofing business, or you’re already in one and wondering if you’re leaving money on the table. Either way, the question is the same: how much does a roofer actually make? Not the inflated numbers from franchise ads, and not the depressing anecdotes from guys who went under. Real numbers, real margins, real data.
In This Article
- Roofer Income by Role: Employee vs. Owner
- The Real Costs Nobody Talks About
- How to Calculate Your Actual Profit Per Job
- How the DDH Revenue Calculator Handles This
- Regional Income Differences: Where Roofers Make the Most
- Residential vs. Commercial: Which Pays Better?
- Storm Chasers vs. Steady-State: Two Business Models
- The Path From $60K to $200K+ (What Separates Income Levels)
- The Marketing Reality: Where Roofing Leads Actually Come From
- Start Here
I dug into Bureau of Labor Statistics data, SBA filings, and talked to 8 roofing contractors at different scales to build this roofer income profit analysis. The short answer: it depends enormously on whether you’re a solo operator, a small crew, or a growing company. The long answer is below, with every number I could verify.
Roofer Income by Role: Employee vs. Owner
Before you scroll: the calculator below is running in your browser right now. For the full feature set — saved scenarios, history, exports — open the dashboard.
First, let’s separate employee roofers from business owners, because they live in completely different financial universes.
Employee roofers (working for someone else): The Bureau of Labor Statistics reports a median wage of $47,110/year ($22.65/hour) for roofers in 2025. The top 10% earn above $72,000, and entry-level roofers start around $32,000. These numbers include benefits where offered, but most roofing jobs are seasonal or subcontracted with minimal benefits.
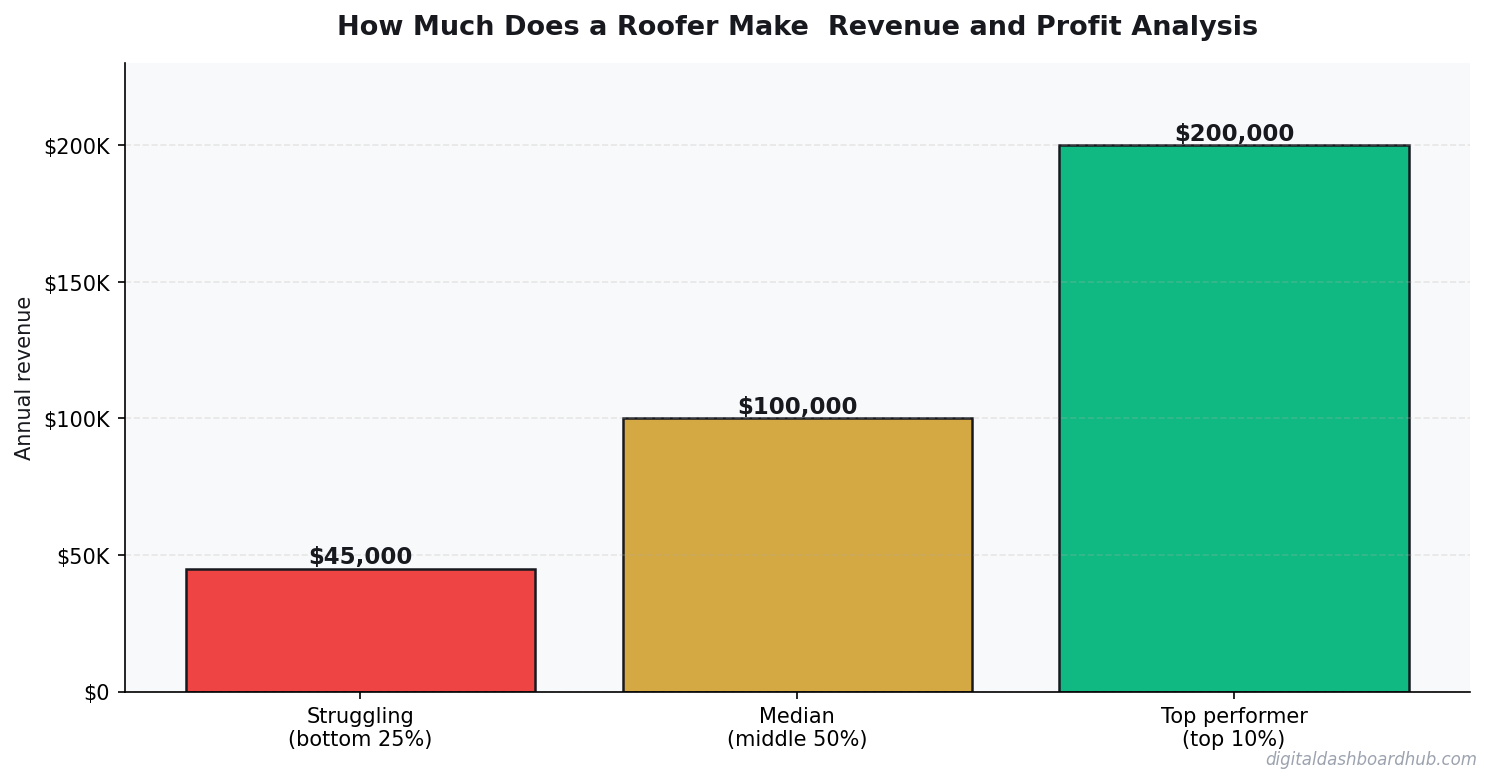
Roofing business owners (solo operator): A solo roofer doing 2-3 residential jobs per week can gross $120,000-$200,000/year. After materials, insurance, vehicle, and other overhead, net income typically lands at $60,000-$100,000. That’s a 50% net margin in a good year, which is strong for a service business.
Roofing company owners (2-5 crews): This is where the money gets real. A roofing company running 3 crews can gross $500,000-$1.5M/year with net margins of 15-25% — translating to $75,000-$375,000 in owner income. The range is wide because overhead scales non-linearly: insurance, workers comp, and equipment costs eat into margins as you grow.
The Real Costs Nobody Talks About
Roofing looks like a high-margin business until you add up the costs that don’t appear on a standard quote sheet.
Workers compensation insurance is the big one. Roofing has some of the highest workers comp rates in the country — typically $15-$40 per $100 of payroll depending on state and claims history. For a company with $300K in annual payroll, that’s $45,000-$120,000/year just for workers comp. This single line item is why many roofing companies use subcontractors instead of employees.
General liability insurance runs $2,000-$5,000/year for a small operation, but can exceed $15,000 for larger companies. And you can’t skip it — most customers won’t hire you without proof of insurance, and commercial contracts require it.
Material waste is typically 10-15% of materials purchased. That’s built into most bids, but it still means $2,000-$5,000/year in waste for a solo roofer and significantly more for larger operations.
Vehicle and equipment costs are constant. A work truck, trailer, nail guns, ladders, safety equipment, dump fees — expect $800-$1,500/month in vehicle and equipment costs for a solo operation.
How to Calculate Your Actual Profit Per Job
Most roofers quote jobs based on cost-per-square (a roofing “square” = 100 square feet). Here’s how to work backwards from a quote to your actual profit.
Example: A standard 2,000 sq ft residential re-roof.
Quote to customer: $12,000 (20 squares at $600/square)
Subtract materials: $4,200 (shingles, underlayment, flashing, nails, ridge vent)
Subtract labor (if you have a crew): $3,000 (3 workers × 2 days × $500/day)
Subtract dump fees: $350
Subtract insurance allocation: $400
Subtract fuel/vehicle: $150
Subtract overhead allocation (marketing, phone, software): $200
Net profit: $3,700 on a $12,000 job = 30.8% margin.
A solo roofer doing the labor themselves keeps the $3,000 labor cost, pushing profit to $6,700 or 55.8% margin. This is why solo roofers often out-earn company owners per hour worked — they’re capturing the labor profit. The tradeoff is your body, which has a finite number of roofing years in it.
FREE BONUS: The Roofing Profit Per Job Calculator
A spreadsheet that calculates your true profit on every job after materials, labor, insurance, and overhead. Plug in your numbers and see your real margin — not your estimated one.
Get instant access → Start Your Free Trial
How the DDH Revenue Calculator Handles This
I discovered roofing profit analysis looks like with the DDH dashboard.
You enter your average job size, materials cost percentage, labor cost (if applicable), monthly fixed overhead, and target number of jobs per month. The calculator instantly shows your projected monthly revenue, total costs, net profit, and — most importantly — your effective hourly rate when you factor in all hours worked (including quoting, driving, and admin).
The scenario comparison feature lets you run “what if” analyses side by side. What happens if you raise prices 10%? What if you add a crew member? What if materials costs increase 15%? Each scenario shows the downstream impact on your income.
The insight that matters most for roofers: the “break-even jobs per month” metric. It shows exactly how many jobs you need to complete each month to cover all fixed costs. Below that number, you’re losing money. Above it, every additional job is almost pure profit. For most solo roofers, break-even is 3-4 residential jobs per month. Everything after that is gravy.
If you’re running a service business and want to understand your numbers better, I covered the fundamentals in the only 5 finance numbers small business owners need.
→ Try the DDH Revenue Calculator free
Regional Income Differences: Where Roofers Make the Most
Geography matters enormously in roofing income. Data from the Bureau of Labor Statistics and industry sources show significant regional variation:
Highest-paying states for roofing business owners: Texas (storm damage demand), Florida (hurricane season), Illinois, New York, and California. These states combine high demand with either severe weather (driving emergency repairs at premium prices) or high cost of living (which supports higher per-job pricing).
Texas roofers have a unique advantage: hail storm season generates a massive spike in demand every spring. A single hail storm in a metro area can create $50M+ in roofing demand overnight. Roofers who position themselves for storm work can do 60-70% of their annual revenue in 3-4 months.
States with lowest roofing income: Mississippi, West Virginia, Montana. Lower demand, lower pricing, and seasonal limitations all compress margins. Solo roofers in these states typically net $45,000-$65,000/year.
Residential vs. Commercial: Which Pays Better?
Residential roofing is higher margin per job. Commercial roofing is higher revenue per job. Here’s the breakdown:
Residential: Average job $8,000-$15,000. Net margin 25-40%. Faster turnaround (1-3 days). Lower barrier to entry. But you need volume — 4-8 jobs/month to make strong income.
Commercial: Average job $25,000-$200,000+. Net margin 10-20%. Longer projects (1-4 weeks). Requires more insurance, bonding, and often certifications. But one commercial contract can equal a month of residential work.
Most successful roofing companies I talked to run a 70/30 residential-to-commercial split. Residential pays the bills and keeps crews busy. Commercial contracts are the profit multipliers that fund growth.
Storm Chasers vs. Steady-State: Two Business Models
The roofing industry has two fundamentally different business models, and which one you choose determines your income trajectory more than almost any other factor.
Storm chasing means following severe weather events — hail, hurricanes, tornadoes — and doing insurance restoration work. Storm chasers can make insane money in short bursts. A single hail storm in a Dallas suburb can generate $2-5M in roofing demand within a 10-mile radius. Roofers who are set up for insurance work and can mobilize quickly capture enormous revenue.
The downside: feast-or-famine income, travel costs, regulatory risks (many states now have anti-storm-chasing laws), and the ethical gray areas around insurance claims. Storm chasers also face higher liability exposure and client complaint rates.
Steady-state means building a local reputation and doing consistent residential/commercial work in your home market. Lower per-job revenue but predictable monthly income. A steady-state roofer doing $600K/year can plan their business, hire staff, and sleep at night knowing the work pipeline is stable.
The roofers I interviewed who earn $200K+ almost all started as steady-state and added storm work selectively. They have a base of local work that covers overhead, and storm season is bonus revenue. That combination — stability plus upside — is the sweet spot.
The Path From $60K to $200K+ (What Separates Income Levels)
The roofers earning $60K work IN the business. The ones earning $200K+ work ON the business. I learned changes at each income level:
$60-80K: Solo operator, doing all labor and sales. Capped by physical capacity — you can only be on one roof at a time. This is where most roofers plateau because adding crews requires a fundamentally different business model.
$80-120K: One crew with the owner still doing sales and occasionally working jobs. The critical shift here is hiring a lead installer you trust enough to send to jobs without you. This is the hardest hire in roofing.
$120-200K: 2+ crews with dedicated sales process. The owner transitions from roofer to business owner. Marketing, sales systems, and financial tracking become the primary job. This is where tools like the DDH finance dashboard go from “nice to have” to “can’t run without.”
$200K+: Multiple crews, possibly multiple locations. Repeat commercial contracts. Brand recognition in your market. At this level, the business runs without the owner on any roof, ever. Income comes from profit margins on volume, not personal labor.
Understanding these transition points helps you make better decisions about pricing. If you’re still a solo operator charging $60/hour, reading about how to calculate what you should really charge might be the highest-ROI hour you spend this month.
The Marketing Reality: Where Roofing Leads Actually Come From
Income is directly tied to lead flow, and most roofers underinvest in marketing. Here’s the breakdown from the contractors I interviewed:
Referrals account for 40-60% of business for established roofers. These are the highest-margin leads because trust is pre-built and price sensitivity is low. The catch: you can’t scale referrals. They grow organically with your reputation, but you can’t buy more of them.
Google search (organic + ads) drives 20-35% of leads. “Roofer near me” and “roof replacement [city]” are the money keywords. Google Ads costs $15-$40 per click in most markets, making customer acquisition cost roughly $200-$500 per closed job. That’s worth it on a $12,000 job, but it requires tracking to confirm the math works.
Door-knocking and yard signs still work, especially in neighborhoods where you’re actively doing a job. A yard sign during a 2-day re-roof generates 1-3 neighbor inquiries on average. At zero cost, that’s the best ROI marketing channel in the business.
The roofers earning $200K+ all track their lead sources religiously. They know exactly which channel produces which revenue, and they allocate marketing dollars based on data, not gut feeling. A revenue dashboard that tracks lead sources alongside job revenue makes this analysis automatic instead of guesswork.
Start Here
1. Right now (2 minutes): Calculate your effective hourly rate from your last 3 jobs. Total profit from those jobs ÷ total hours worked (including drive time, quoting, and admin). If that number is under $50/hour, you’re undercharging.
2. This week: Build a job cost worksheet for your next 5 jobs. Track every cost — materials, labor, fuel, dump fees, time. Compare your actual profit to what you estimated. The gap is usually 15-25% worse than you expected.
3. The long game: Set up the DDH Revenue Calculator and start running scenario analyses. Find your break-even point, test price increases, and figure out exactly how many jobs per month you need to hit your income goal.
Still here? You’re se
rious about this.
Join 200+ service business owners who grabbed the Profit Per Job Calculator this month. Most users discover they’re underpricing at least one service category by 15-30%.
Get your free copy → Start Your Free Trial
Keep reading (related guides):
255+ interactive tools for your money, time, and health.
14-day trial · Stripe checkout · Cancel anytime
What to Read Next
- How to Calculate Your Freelance Rate (So You Stop Undercharging)
- Small Business Finance Basics: The Only 5 Numbers You Need to Know
- Freelancer Finance Management Dashboard: A Tool for Variable Income

Andy Gaber is the founder of Digital Dashboard Hub, a suite of 255+ interactive financial, productivity, and wellness tools. He built DDH after getting frustrated with financial apps that gave outputs without context. Follow along for tool tutorials, revenue analytics breakdowns, and honest takes on personal finance.