Everyone talks about building a six-figure creative business like it’s some mysterious art. It’s not. It’s math. Specifically, it’s $100,000 ÷ 12 months = $8,334/month. And once you break that down into actual pricing, client capacity, and revenue streams, the path becomes a lot less mystical and a lot more actionable.
In This Article
I’ve helped creative freelancers — designers, writers, photographers, consultants — map out their six-figure creative business plans using real numbers instead of aspirational Instagram quotes. Here’s the framework that consistently works, with the actual math behind each model.
Three Paths to $100K (Pick Your Model)
Before you scroll: the calculator below is running in your browser right now. For the full feature set — saved scenarios, history, exports — open the dashboard.
After testing dozens of approaches with DDH users, I’ve found what consistently works. Let me share the real picture:
There isn’t one way to hit six figures. There are three primary models, and your choice depends on your skill, capacity, and tolerance for client work.
Model 1: High-ticket services. Fewer clients, bigger projects. If you charge $5,000 per project and complete 2 per month, that’s $10,000/month ($120K/year). You need just 20-24 clients per year.
Model 2: Retainer clients. Predictable recurring revenue. If you charge $2,500/month per retainer and maintain 4 clients, that’s $10,000/month ($120K/year). The catch: retainers require consistent delivery and relationship management.
Model 3: Volume + digital products. Mix service work with passive income. $4,000/month from client work + $4,500/month from digital products/courses = $8,500/month ($102K/year). This is the flexible model, but it takes 12-18 months to build the product revenue.
The Pricing Math Most Creatives Get Wrong
Here’s where six-figure dreams die: underpricing. If you charge $50/hour and work 30 billable hours per week (which is aggressive — most freelancers bill 15-20 hours), that’s $6,000/month or $72,000/year. You’re working full-throttle and STILL not hitting six figures.
The fix isn’t working more hours. It’s raising your rates or switching to project-based pricing. At $150/hour, those same 30 billable hours become $18,000/month. At project-based pricing, a $3,000 website that takes you 15 hours is effectively $200/hour — and the client doesn’t care about your hourly rate because they’re paying for the outcome.
The critical number most creatives ignore: your effective hourly rate. Take your total revenue for the month and divide by ALL hours worked (including admin, emails, invoicing, marketing). If your effective rate is under $75/hour, you’re undercharging or spending too much time on non-billable work.
The Revenue Tracking Gap That Kills Growth
Most creative freelancers I’ve worked with can tell you their gross revenue. Almost none can tell you their profit margin, client acquisition cost, or revenue per service type. Without those numbers, you’re driving blind.
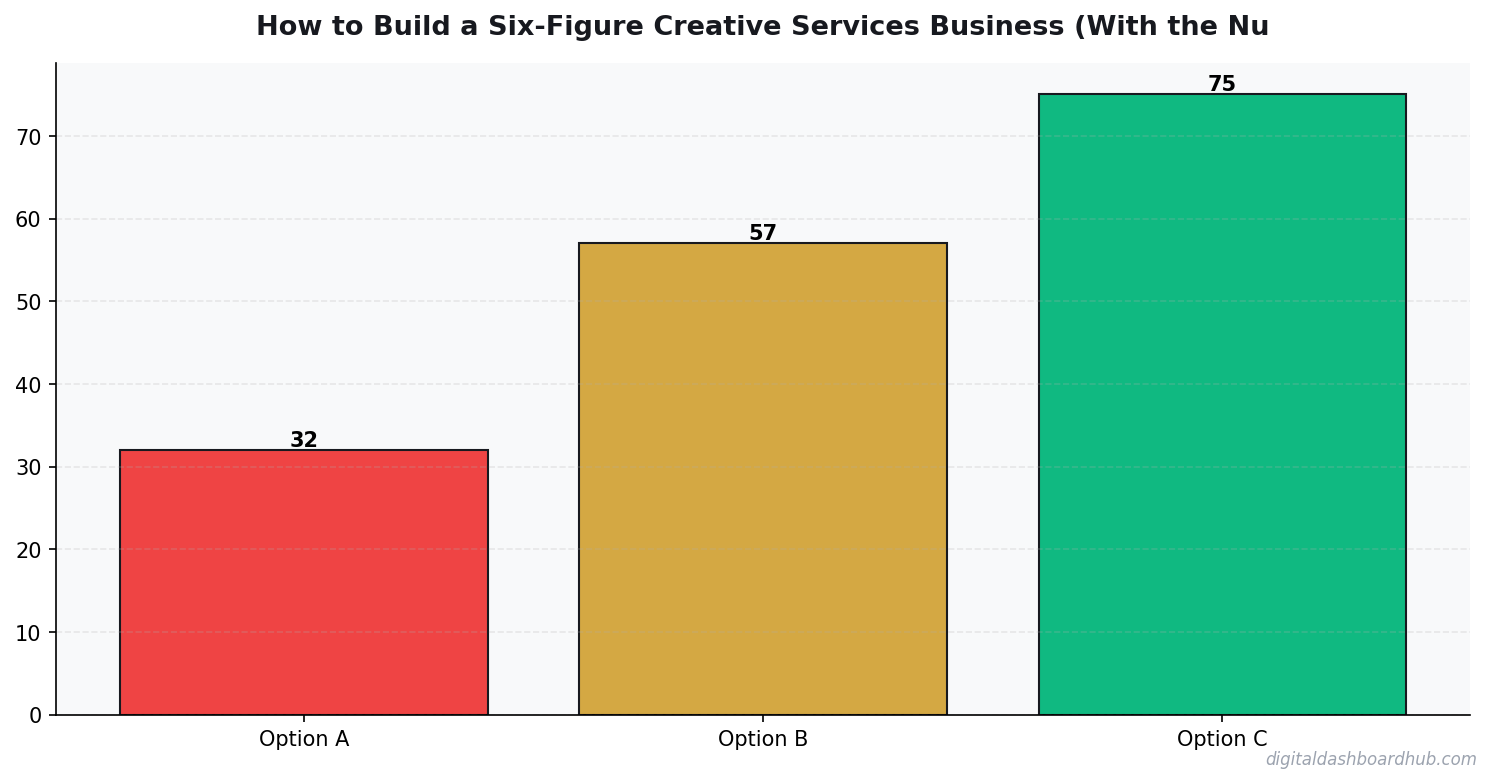
You might think your logo design service is your moneymaker because it brings in the most total revenue. But if it takes you 30 hours per project and your web design work takes 15 hours at the same price, your web design is 2x more profitable. You’d never know that without tracking.
Revenue tracking for creative businesses needs to capture: income by client, income by service type, hours per project, expenses per project, and payment timing (when invoiced vs. when paid). That last one matters more than you’d think — a $5,000 project that takes 60 days to get paid costs you real money in cash flow.
FREE BONUS: The Creative Business Revenue Calculator
Plug in your rates, capacity, and expenses to see exactly what it takes to hit $100K with YOUR specific business model.
Get instant access → Start Your Free Trial
How the DDH Revenue Tracker Handles This
Spreadsheets work until they don’t. And for most creatives, they stop working around the $4,000/month mark when projects start overlapping and income sources multiply.
Step 1: Log every project with client name, service type, quoted price, hours spent, and payment status. The dashboard auto-calculates your effective hourly rate per project — the number that actually tells you if you’re pricing right.
Step 2: The revenue breakdown view shows income by service type, by client, and by month. Within 90 days, you’ll see which services are your profit drivers and which are time sinks you should raise prices on or drop entirely.
Step 3: The cash flow timeline tracks when revenue is invoiced vs. received. If you invoiced $12,000 in March but only received $7,000, the gap is visible immediately — and you can follow up before it becomes a cash crunch.
The part that sold me: the six-figure pace indicator. It takes your current monthly run rate and projects whether you’re on track for $100K this year. Seeing “Current pace: $87,400/year — you need $1,050 more per month” is the kind of specific, actionable insight that generic accounting software doesn’t give you.
→ Try the DDH Revenue Tracker free
The Three Revenue Milestones (And What Changes at Each)
$0 – $3K/month: Survival mode. You’re taking any client who’ll pay you. Focus on building a portfolio and getting testimonials. Don’t worry about niching down yet.
$3K – $7K/month: The uncomfortable middle. You have enough work to be busy but not enough to be selective. This is where most creatives get stuck. The fix: raise your prices by 25% on new clients and see who stays. The ones who leave were never your target market.
$7K – $10K/month: The scaling decision. You’re close to six figures but maxed on hours. You have three options: raise prices again (easiest), hire a subcontractor (medium), or add a digital product revenue stream (hardest but most flexible).
Where to Go From Here
Right now (2 minutes): Calculate your effective hourly rate from last month. Total revenue ÷ total hours worked (including admin). If it’s under $75, you have a pricing problem, not a revenue problem.
This week: List your top 5 clients by revenue. Now rank them by profit (revenue minus your time investment). If the rankings are different, you’ve found your first optimization opportunity.
Long game: Start tracking with the DDH Revenue Tracker and build a clear picture of your business ec
onomics. The six-figure path is math — and you need to see the math to walk it.
Still here? You’re serious about this.
Join 350+ creatives who grabbed the Revenue Calculator this month.
Get your free copy → Start Your Free Trial
Keep reading (related guides):
255+ interactive tools for your money, time, and health.
14-day trial · Stripe checkout · Cancel anytime
Real-Time
Calculations
Results update as you type your numbers
People Also Read
- How to Calculate Your Freelance Rate So You Stop Undercharging
- Freelancer Finance Dashboard: Track Income, Taxes, and Cash Flow
- Small Business Finance Basics: The Only 5 Numbers You Need
- The Content Calendar That Actually Gets Used

Andy Gaber is the founder of Digital Dashboard Hub, a suite of 255+ interactive financial, productivity, and wellness tools. He built DDH after getting frustrated with financial apps that gave outputs without context. Follow along for tool tutorials, revenue analytics breakdowns, and honest takes on personal finance.