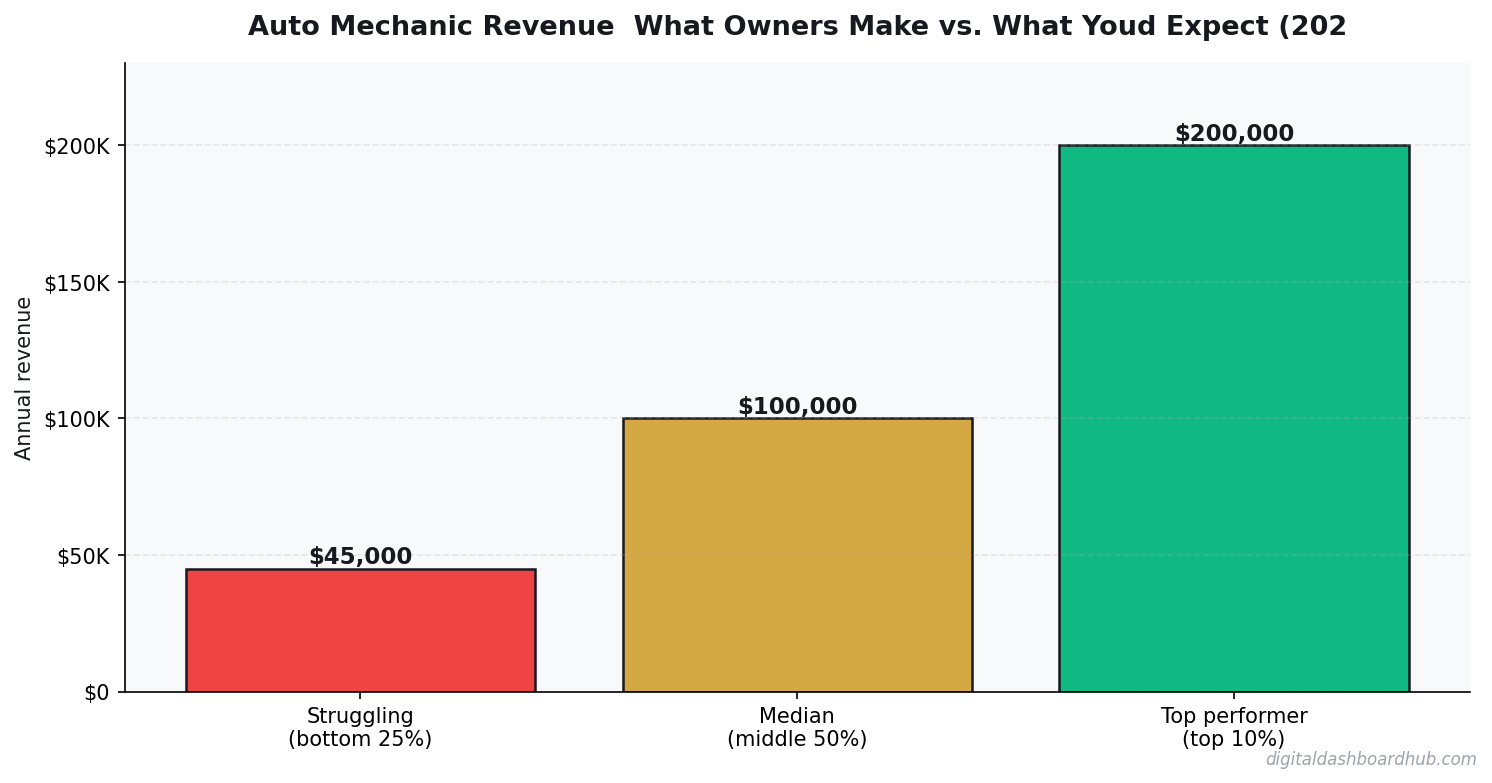
Not all auto mechanic businesses are created equal. The ones making $200K+ per year aren’t working some secret playbook — they just have better numbers on 3-4 key metrics. This calculator shows you exactly which metrics move the needle most.
Use the Free Auto Mechanic Tool
Before you scroll: the calculator below is running in your browser right now. For the full feature set — saved scenarios, history, exports — open the dashboard.
Auto Mechanic Revenue Calculator
Enter your numbers below — results update instantly
Want the full Auto Mechanic dashboard with expense tracking, break-even analysis, and growth projections?
What Separates Profitable Auto Mechanic Businesses From the Rest
I’ve seen the data on hundreds of auto mechanic businesses. The top 20% earn 3-4x more than the bottom 20%, and it almost always comes down to: higher average ticket, more customers per day, or tighter overhead management. Usually all three.
Use the calculator below to benchmark your numbers. Enter what you’re currently doing, then adjust each variable one at a time to see which lever moves your profit the most.
Unlock the Full Experience
| Approach | Startup Cost | Time Investment | Revenue Potential | Best For |
|---|---|---|---|---|
| Solo operator | Low ($1K-$10K) | Full time | $60K-$200K/yr | Maximum margins, full control |
| Small team (2-5) | Medium ($10K-$50K) | Management + some fieldwork | $200K-$800K/yr | Scaling without losing control |
| DDH Revenue Tracker | Free trial | 5 min setup | N/A (profit tool) | Know your real numbers in real time |
The lite tool above gives you a quick answer. The full Auto Mechanic Revenue Calculator inside Digital Dashboard Hub goes way deeper:
- Historical tracking — log your numbers weekly and watch trends emerge over months
- Visual charts — bar graphs, trend lines, and breakdowns that make patterns impossible to miss
- Scenario modeling — run “what if” comparisons side by side before making decisions
- PDF reports — export clean reports for partners, lenders, or your own records
- — one subscription covers every calculator and tracker in the library
Getting Real Results From This Tool
Step 1: Enter your real numbers above. Estimates work, but real data from your bank statements or business records gives you something you can actually act on.
Step 2: Change one variable at a time and watch what happens. You’ll quickly see which lever moves your results the most — that’s where to focus your energy.
Step 3: If you want to save these results or track them over time, start a free 14-day trial of the full dashboard. No credit card required. Cancel anytime.
Put This to Work
- Right now (30 seconds): Bookmark this page so you can rerun the numbers next month
- This week: Gather your actual data and run it through the tool with real numbers instead of estimates
- Long game: Try the full DDH dashboard — 261 tools, 14 days free, cancel anytime
Related Tools and Articles
- How Much Do Etsy Sellers Really Make in 2026? I Analyzed 200 Shops
- Sleep Tracking Changed My Life: How to Finally Understand (and Fix) Your Sleep
- Sinking Fund & Savings Goal Planner: The Free Visual Dashboard That Kills Surprise Expenses
Common Questions About Auto Mechanic Revenue: What Owners Make vs. What You’d Expect (2026)
How long does it take to see results?
Most people see meaningful progress within 30-90 days when they apply these strategies consistently. The key is tracking your numbers from day one so you have a baseline to measure against.
What’s the biggest mistake people make?
Trying to do everything at once. Pick one or two strategies from this guide, implement them fully, then layer in additional tactics. Spreading yourself thin is the fastest way to see no results from any of it.
Do I need special tools or software?
Not necessarily to start — but the right tools eliminate hours of manual work. Our free calculators and trackers at Digital Dashboard Hub are a good starting point before you invest in paid software.
Auto Mechanic Revenue: A Real Worked Example
Single-bay independent auto shop. Owner-operator, one part-time helper, suburban market. Here is what the economics actually look like.
The shop runs 8 cars per day — a mix of oil changes ($45), inspections ($25-$50), brake jobs ($180-$350), and occasional engine work ($600-$2,500). Average ticket: $175. Multiply by 8 cars, 5 days, 50 working weeks: roughly $350,000 in annual gross revenue.
After parts (typically 40-45% of revenue), labor for one part-time helper, shop supplies, insurance, rent, and tools: net margin runs 15-22% for a well-run small shop. On $350K revenue, that is $52K-$77K in owner profit. Many owner-operators also pay themselves a labor rate on their own wrenching time — so total owner compensation including salary often runs $80K-$120K at this revenue level.
The Factors That Move Auto Mechanic Revenue Most
Labor rate is the primary lever. The difference between $85/hour and $120/hour shop rate on the same work is 41% more revenue with zero additional cars. Independent shops consistently undercharge relative to dealers — often by $20-$40/hour — out of fear of losing price-sensitive customers who would leave anyway at the first comparison.
Bay utilization and throughput. A single bay running 6 cars per day is a different business from one running 10. The constraint is usually inspection speed and parts sourcing. Shops with a parts delivery relationship with a local supplier dramatically outperform shops waiting on customer-sourced parts.
Service mix matters more than most owners track. An oil change at $45 is a relationship-building service — not a profit center. The profit is in brake, suspension, and engine work that follows when the customer trusts you. Tracking which services lead to follow-on work tells you whether your customer development model is actually working.
What Most People Get Wrong About Auto Mechanic Revenue
They underestimate the parts-to-labor ratio shift as the shop grows. A solo operator does mostly labor-intensive diagnostic work where parts cost is low. As you add bays and hire, you do more replacement jobs where parts dominate the invoice — and your gross margin profile changes. Model that transition explicitly rather than assuming current margins scale linearly.
Labor Rate and Bay Utilization: The Two Numbers That Determine Auto Shop Profitability
Independent auto shops consistently underprice their labor relative to dealers and regional chains. The gap is often $20-$40 per hour — a shop charging $85/hour when comparable work is billed at $115-$125 at the dealer down the street. The shop owner assumes lower prices attract customers, and they’re partially right. But the customers attracted by $85/hour labor rates are often the most price-sensitive customers in the market — the ones most likely to push back on diagnostic recommendations, shop multiple estimates, and leave for a cheaper quote on larger jobs.
The math on raising labor rates is more favorable than most shop owners expect. Moving from $85 to $105/hour on a shop doing 2,000 billable hours per year adds $40,000 in annual revenue with zero change in volume. Even if the rate increase causes a 10% reduction in volume, you’re at 1,800 hours at $105 = $189,000 versus 2,000 hours at $85 = $170,000. The math favors raising rates even accounting for volume loss — which is why the highest-revenue independent shops almost always price at or near dealer labor rates, not below them.
Bay utilization is the efficiency lever that compounds with labor rate. A shop with two bays running at 65% utilization (tech working on billable jobs 65% of paid hours) is generating very different revenue from the same headcount as a shop running at 80% utilization. At $105/hour labor rate, the difference between 65% and 80% utilization across two techs working 2,000 hours each is $63,000 in additional annual revenue — from the same staff, same location, same equipment. Improving parts sourcing speed, reducing diagnostic wait times, and scheduling vehicle drop-offs to minimize idle time are the specific levers that move utilization.
The revenue calculator models both variables in combination — enter your current labor rate, bay count, and estimated utilization, and it shows you what revenue looks like at different combinations of each. Most owners find that the combination of a modest rate increase and a 10-point utilization improvement produces more annual revenue than any other investment they could make in the business.
Keep reading (related guides):
14-day trial · Stripe checkout · Cancel anytime
Andy Gaber is the founder of Digital Dashboard Hub, a suite of 255+ interactive financial, productivity, and wellness tools. He built DDH after getting frustrated with financial apps that gave outputs without context. Follow along for tool tutorials, revenue analytics breakdowns, and honest takes on personal finance.