If you’ve ever Googled “how much does a boutique make?” you already know the answers are all over the place. Some sites say $50K. Others say $500K. The real answer depends entirely on your numbers — and that’s exactly what the free calculator below figures out.
Use the Free Boutique Tool
The dashboard below loads instantly in your browser. Plug in your numbers, see your answer. No signup to try the basics.
Before DDH, I was doing this manually in spreadsheets. Here’s the faster way:
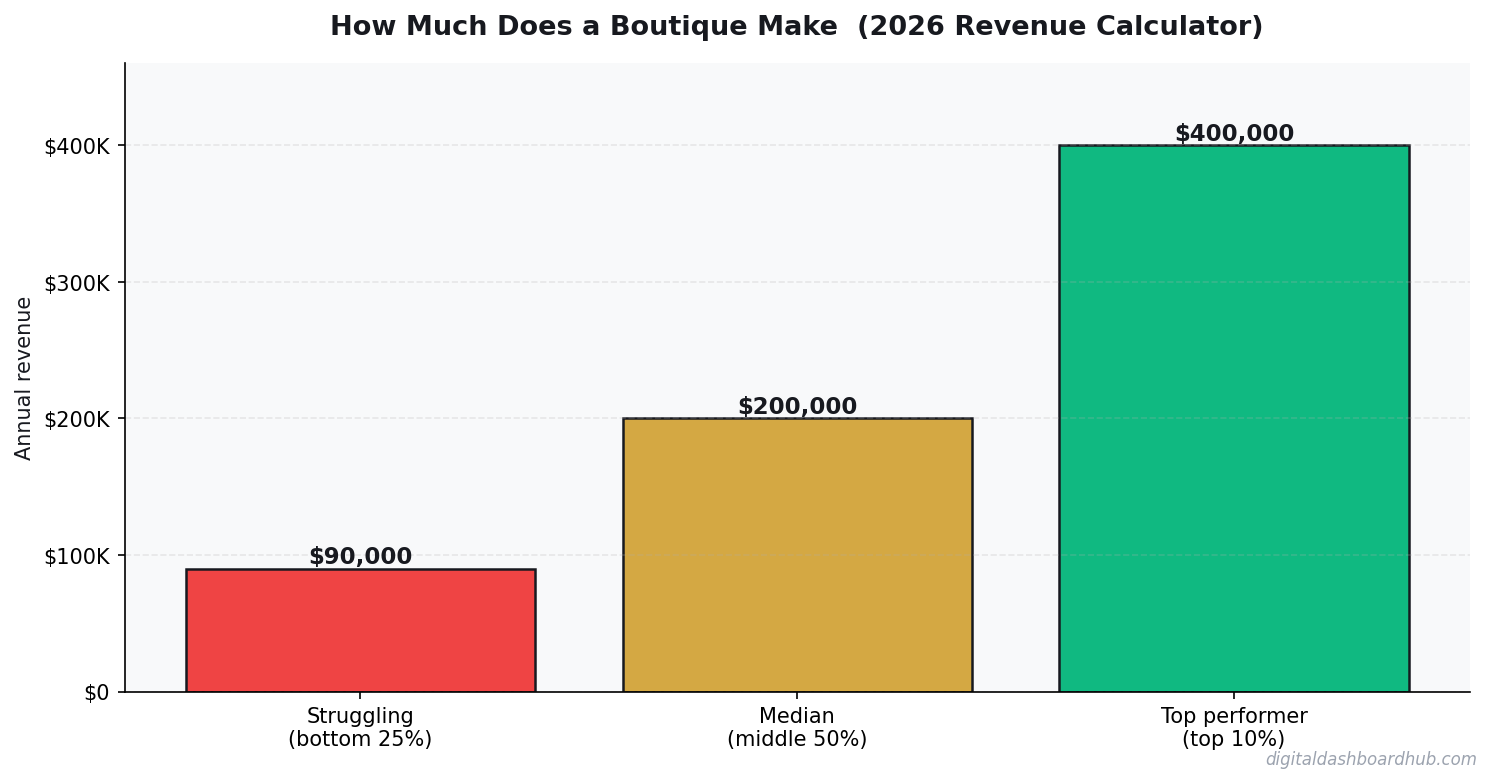
What Boutique Owners Actually Take Home
An independent boutique grosses $20K-$40K/month with a 50-55% markup on wholesale. After rent ($2K-$5K), staff ($3K-$6K), inventory replenishment, and markdowns, net margins are 10-15%.
Sell-through rate (% sold at full price) separates profitable boutiques from ones slowly going under. Industry average is 60%. Top performers hit 75%+.
Decoding the Financials
| Approach | Startup Cost | Time Investment | Revenue Potential | Best For |
|---|---|---|---|---|
| Solo operator | Low ($1K-$10K) | Full time | $60K-$200K/yr | Maximum margins, full control |
| Small team (2-5) | Medium ($10K-$50K) | Management + some fieldwork | $200K-$800K/yr | Scaling without losing control |
| DDH Revenue Tracker | Free trial | 5 min setup | N/A (profit tool) | Know your real numbers in real time |
The biggest line item? Inventory investment ties up $20k-$80k in cash — and markdowns on unsold inventory are where profit goes to die.
Reducing dead inventory by 10% frees up $5K-$10K in cash for proven sellers. Fewer SKUs, deeper on winners — changes the whole financial picture.
The #1 Financial Blind Spot
Buying too wide. 30 styles with 2 of each sells worse than 10 styles with 6 of each. Depth beats breadth — you need sizes and colors in stock when customers want them.
Holiday (Nov-Dec) is 25-30% of annual revenue. Spring arrivals (March-April) is the second peak. January and July are markdown months.
The Dashboard Behind This Calculator
How to Use This Calculator
Start by entering your actual numbers — not estimates. Pull from your bank statements, your POS system, or your accounting software. The difference between estimated and real inputs is usually the difference between “this looks fine” and “oh, that’s where the money is going.”
Then change one variable at a time. For boutique, the lever that usually moves the needle most is reducing dead inventory by 10% frees up $5k-$10k in cash for proven sellers. Start there.
If you want to save these projections, track them month-over-month, or model different scenarios side by side, the full dashboard does all of that. Free 14-day trial, no credit card required.
Your Next Move
Related Tools and Articles
- Free ADHD Impulse Spending Tracker — Try It Now
- ADHD Daily Routine Planner: How to Build Structure That Works With Your Brain (Not Against It)
- Workout Progress Tracker: The Method That Finally Kept Me Consistent
Common Questions About How Much Does a Boutique Make? (2026 Revenue Calculator)
How long does it take to see results?
Most people see meaningful progress within 30-90 days when they apply these strategies consistently. The key is tracking your numbers from day one so you have a baseline to measure against.
What’s the biggest mistake people make?
Trying to do everything at once. Pick one or two strategies from this guide, implement them fully, then layer in additional tactics. Spreading yourself thin is the fastest way to see no results from any of it.
Do I need special tools or software?
Not necessarily to start — but the right tools eliminate hours of manual work. Our free calculators and trackers at Digital Dashboard Hub are a good starting point before you invest in paid software.
What a Real Boutique Earns: The Worked Example
A women’s clothing boutique in Savannah, GA — 1,100 sq ft, curated contemporary style, open 6 days a week. Average daily transactions: 22. Average ticket: $87 (a mix of $45 accessories and $120-$160 apparel pieces). Daily gross: $1,914. Annual gross at 295 operating days: $564,630.
Boutique COGs run 40-50% — you’re buying at wholesale and marking up to retail. At 45%: $254,000 in cost of goods. Rent at $3,200/month: $38,400. Sales associate labor (1 part-time, 30 hrs/week at $16/hour): $24,960. Everything else — hangers, fixtures, bags, insurance, POS, utilities: $28,000. Owner net: approximately $219,000. On $565K gross revenue. That’s a solid independent boutique — if you execute on buying and merchandising.
The boutiques that don’t make it are usually carrying dead inventory. Apparel that doesn’t sell doesn’t just sit on a rack — it ties up cash, takes up floor space, and signals to customers that something is off about your curation. Mark it down, move it out, reinvest in what sells.
The 3 Levers That Move Boutique Revenue Most
1. Inventory turnover rate. A boutique that turns its inventory 4 times per year is dramatically more profitable than one that turns it twice. Fresh, seasonal, curated arrivals give customers a reason to come back monthly. “I want to see what’s new” is the most valuable customer behavior a boutique can cultivate — and it’s driven entirely by buying strategy and visual merchandising, not marketing.
2. Average transaction value through styling. A customer who came in for a blouse and left with a blouse, a necklace, and a belt spent $200+ instead of $65. The boutiques with the highest average tickets have staff trained to style, not just ring up. Suggesting the complete look — and having the accessories in stock to complete it — is a pure margin play that costs nothing beyond training.
3. Omnichannel presence. A boutique with an active Instagram and a basic online store reaches customers who would never walk in physically. The customer who discovered you via a styled reel and ordered online costs you $0 in foot traffic overhead for that transaction. Even a basic Shopify store with 20-30 SKUs can add $2,000-$6,000/month for a boutique with any real social following.
What Makes a Boutique Actually Profitable
Buying discipline is everything. A boutique that buys emotional inventory — pieces the owner loves but doesn’t have demand data for — will have dead stock problems. A boutique that buys based on past sell-through data, customer request patterns, and market analysis will turn inventory faster and have better cash flow. This isn’t about suppressing curatorial instinct — it’s about using data to focus that instinct where it works.
Open-to-buy planning allocates your buying budget across categories based on historical performance, so you’re not over-buying dresses in a month that historically undersells them. Most independent boutique owners don’t formally track open-to-buy, and it shows in their inventory turnover.
The best boutiques also have a markdowns strategy, not just a sale. At 8 weeks of low sell-through, reduce by 20%. At 12 weeks, 30-40%. At 16 weeks, whatever it takes to move it. Clothing that’s been in the store for 6 months isn’t getting more appealing — it’s occupying space and capital that could hold something that sells.
Social Commerce as a Revenue Channel
A boutique with 5,000 engaged Instagram followers and a Shoppable feed has a real secondary revenue channel. If 0.5% of followers buy once per month at $75 average ticket, that’s 25 orders or $1,875/month from a channel that costs only time to maintain. With 15,000 followers and a more optimized approach, that math becomes $5,000-$8,000/month — enough to replace a slow rent week.
The content that converts for boutiques isn’t polished studio photography — it’s real try-ons, styling suggestions, “how to wear it three ways” posts. Authentic and specific outperforms beautiful and generic every time. A one-minute Reel showing three outfit combinations using one piece regularly outperforms a professional product photo in driving actual purchase intent.
Inventory Turns: The Metric That Predicts Profitability
Inventory turnover — how many times per year you sell through your entire stock — is the single best predictor of boutique profitability. Industry average for specialty retail is 4-6 turns per year. Under 3 turns means dead stock is building and cash flow is tightening. Above 6 means strong demand and efficient buying, and you should consider increasing inventory investment.
Calculate yours: divide your annual cost of goods sold by your average inventory value (beginning inventory + ending inventory ÷ 2). If you sold $254,000 in COGS and your average inventory value was $72,000, you turned inventory 3.5 times — low side of acceptable. Finding which specific categories are dragging that number down (often accessories or a specific apparel category that was over-bought) lets you fix the problem precisely rather than across the board.
Keep reading (related guides):
255+ interactive tools for your money, time, and health.
Full dashboard access · Stripe-secure checkout · Cancel anytime
What Most People Get Wrong
The single biggest mistake is treating revenue as the headline number. Revenue is vanity — margin is sanity, and cash-in-bank is reality. Two operators with identical top-lines routinely end the year $80K apart in take-home, because one priced for volume and the other priced for sustainability. The calculator above forces you to surface that gap before it hits your bank account.
The second mistake is modeling a “best case” and planning around it. The number you should plan around is the 30th-percentile scenario — enough demand to matter, but slower than you hoped. If the business still covers your living expenses there, you have real margin of safety. If it only works in the 80th-percentile case, you are building on sand.
The third mistake is ignoring your time as a cost. If you would otherwise earn $55/hr at a day job and this operation pays you effectively $18/hr for 60-hour weeks, the gap is the real price of running it. Plug your opportunity cost into the calculator and the picture often flips.
How to Pressure-Test Your Numbers
Start with the calculator, then stress-test three levers independently:
- Pricing: What happens to your take-home if you raise prices 10%, but lose 15% of volume? Most operators are surprised to find net income goes up.
- Costs: What happens if your largest input cost rises 20%? This is not hypothetical — it is a typical 12-month swing in most industries.
- Volume: What happens at 70% of your planned volume for 90 days? If that still covers fixed costs, you have a real business. If not, the model is fragile.
Running the calculator three ways takes about ten minutes. The clarity on the other side of those ten minutes is usually the difference between a confident operating plan and guessing for another six months.
Frequently Asked Questions
How accurate is this calculator?
The underlying math uses industry-standard margin and cost ranges sourced from the How Much Does a Boutique Make? space. Your actual numbers depend on location, seasonality, and operating style, so treat this as a directional benchmark, not a guarantee. The more precisely you enter your inputs, the tighter the output range becomes.
Can I save my results?
A free Digital Dashboard Hub account saves every scenario you run, lets you compare side-by-side, and unlocks the full dashboard with expense tracking and month-over-month charts. The 14-day trial includes the complete tool library — no credit card required to start.
Who is this tool for?
It’s built for anyone pressure-testing a real decision — existing operators auditing their margins, side-hustlers deciding whether to go full-time, and prospective owners trying to sanity-check a business plan before signing a lease. You do not need any accounting background to use it.
What should I do with the results?
Start by comparing the output against your current (or projected) monthly take-home. If the gap is big, walk back the inputs and identify which lever — pricing, volume, or cost structure — is doing the damage. That is usually where the highest-leverage fix lives.
The Bottom Line
Most operators lose money not because the math is impossible, but because they never actually ran it. Fifteen minutes with the calculator beats three months of guessing. Run your numbers, screenshot the output, and use it as the baseline for every pricing and cost decision over the next quarter.
When you are ready to go deeper, the full Digital Dashboard Hub workspace lets you save scenarios, track actuals month-over-month, and see the trend before problems compound. That is the version that actually compounds the effort — spreadsheets forgotten in a Google Drive folder do not.
Next Steps
- Run the calculator above with your best current estimates.
- Re-run it with a pessimistic scenario (lower volume, higher costs) and a stretch scenario (better pricing, more efficient ops).
- Screenshot all three outputs so you have a baseline to compare against when reality arrives.
- Revisit monthly — the number that matters is the one that changes with your real P&L.
Ready for the full dashboard?
Unlock all 255 tools across business, creator, and health workflows.
Andy Gaber is the founder of Digital Dashboard Hub, a suite of 255+ interactive financial, productivity, and wellness tools. He built DDH after getting frustrated with financial apps that gave outputs without context. Follow along for tool tutorials, revenue analytics breakdowns, and honest takes on personal finance.