Not all esthetician businesses are created equal. The ones making $200K+ per year aren’t working some secret playbook — they just have better numbers on 3-4 key metrics. This calculator shows you exactly which metrics move the needle most.
Use the Free Esthetician Tool
Before you scroll: the calculator below is running in your browser right now. For the full feature set — saved scenarios, history, exports — open the dashboard.
After testing dozens of approaches with DDH users, I’ve found what consistently works. Let me share the real picture:
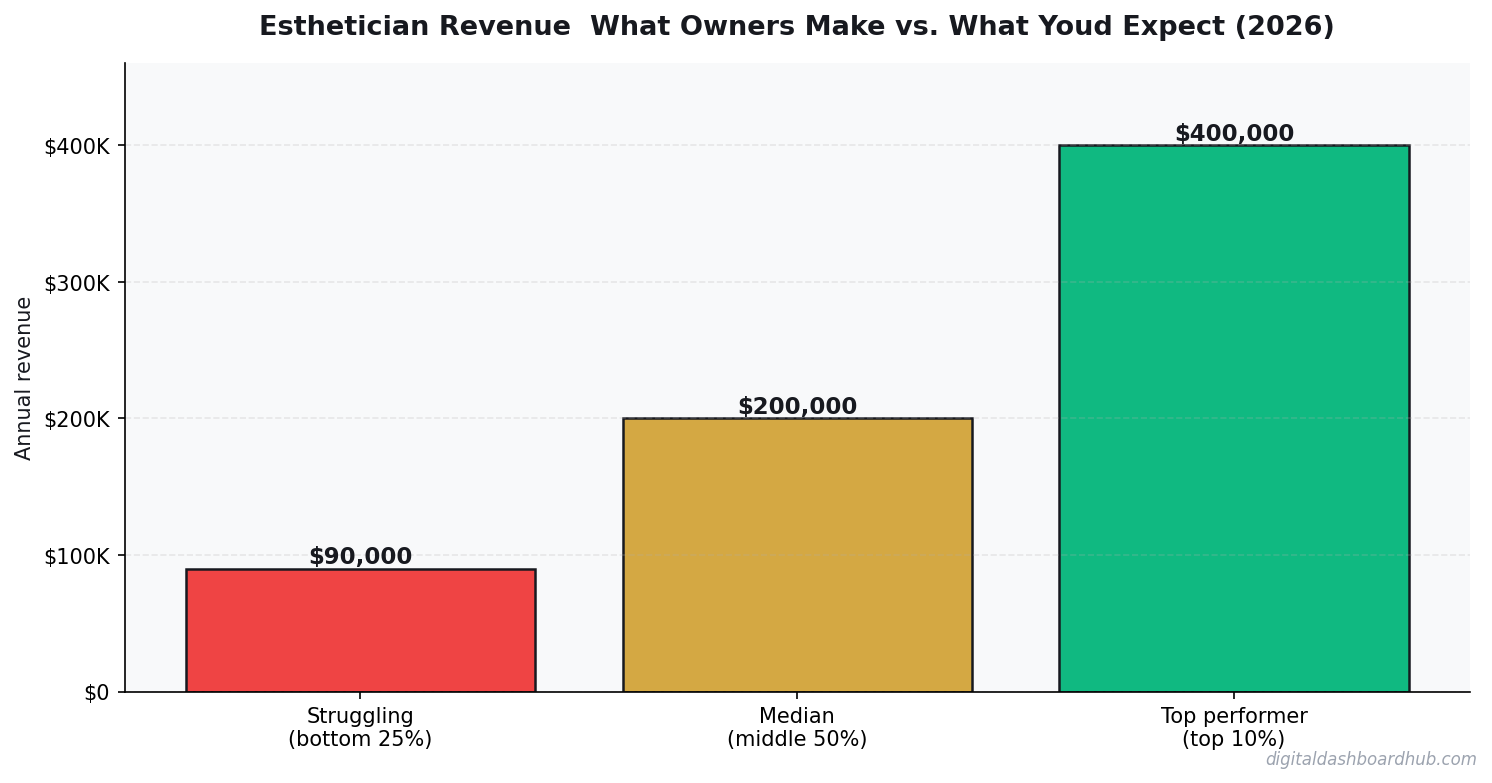
What Esthetician Owners Actually Take Home
A solo esthetician working 25-30 client hours/week typically grosses $8K-$14K/month. Suite rental ($1K-$2K), products (10-15%), insurance ($100-$200), and continuing education leave net margins at 35-45%.
Service time per dollar is the metric. A 30-minute chemical peel at $150 generates $300/hour. A 60-minute facial at $120 generates $120/hour. Same skill, half the revenue rate.
Cost Structure Breakdown
| Approach | Startup Cost | Time Investment | Revenue Potential | Best For |
|---|---|---|---|---|
| Solo operator | Low ($1K-$10K) | Full time | $60K-$200K/yr | Maximum margins, full control |
| Small team (2-5) | Medium ($10K-$50K) | Management + some fieldwork | $200K-$800K/yr | Scaling without losing control |
| DDH Revenue Tracker | Free trial | 5 min setup | N/A (profit tool) | Know your real numbers in real time |
The biggest line item? Product costs run 10-15% of revenue, but rent in a good location (or suite rental at $800-$2k/month) is the real margin killer.
Shifting 30% of bookings from basic facials to advanced treatments (chemical peels, microneedling) can increase monthly income by $2K-$4K without adding hours.
The Hidden Cost Trap
Discounting to fill empty slots. A 20% discount on a $150 service costs you $30 — it takes 5 discounted clients to equal 4 full-price ones.
Pre-wedding season (March-June) and holiday prep (November) are peak. Summer is slower. January sees a bump from skincare resolutions.
What the Full Dashboard Looks Like
How to Use This Calculator
Start by entering your actual numbers — not estimates. Pull from your bank statements, your POS system, or your accounting software. The difference between estimated and real inputs is usually the difference between “this looks fine” and “oh, that’s where the money is going.”
Then change one variable at a time. For esthetician, the lever that usually moves the needle most is shifting 30% of bookings from basic facials to advanced treatments (chemical peels, microneedling) can increase monthly income by $2k-$4k without adding hours. Start there.
If you want to save these projections, track them month-over-month, or model different scenarios side by side, the full dashboard does all of that. Free 14-day trial, no credit card required.
Your Next Move
Related Tools and Articles
- Meditation for Beginners: How to Start When Your Brain Won’t Shut Up
- How to Regulate Your Nervous System: 8 Steps to Move From Chronic Stress to Calm
- Workout Progress Tracker: The Method That Finally Kept Me Consistent
Common Questions About Esthetician Revenue: What Owners Make vs. What You’d Expect (2026)
How long does it take to see results?
Most people see meaningful progress within 30-90 days when they apply these strategies consistently. The key is tracking your numbers from day one so you have a baseline to measure against.
What’s the biggest mistake people make?
Trying to do everything at once. Pick one or two strategies from this guide, implement them fully, then layer in additional tactics. Spreading yourself thin is the fastest way to see no results from any of it.
Do I need special tools or software?
Not necessarily to start — but the right tools eliminate hours of manual work. Our free calculators and trackers at Digital Dashboard Hub are a good starting point before you invest in paid software.
Real Esthetician Revenue: A Worked Example
Take a licensed esthetician in Nashville running a private studio suite — solo operator, no employees. She books 6 clients/day, 4 days/week, 48 working weeks per year. Service mix: signature facials ($95), chemical peels ($130), brow/lash work ($65). Average ticket across all services: $105. That’s $630/day, $2,520/week, $120,960 gross annually.
Deduct suite rent ($900/month or $10,800/year), products and supplies ($8,400/year at roughly 7% COGs), insurance ($1,200/year), and booking software ($900/year). She’s taking home just over $99,000. Working a 4-day week. In a low-overhead solo setup.
That’s the solo ceiling — and it’s a comfortable ceiling. But estheticians who want to break $150K+ need to add retail product sales, hire a second operator, or expand to a team room. Each path has different capital and management requirements, and the calculator lets you model them before you commit.
The 3 Factors That Move Esthetician Revenue Most
1. Retail-to-service revenue ratio. Top-earning estheticians consistently generate 20-30% of total revenue from retail product sales. This isn’t pushy upselling — it’s matching clients with the right at-home routine for their specific skin concerns. A client who buys $80 in products at checkout is also more likely to rebook, because they’re invested in seeing the results.
2. Booking density and rebook rate. An esthetician fully booked 2 weeks out is earning at a completely different rate than one with empty slots in the current week. The difference isn’t always about total client count — it’s about rebook systems. Asking for the next appointment before the client leaves, sending reminders at the right interval, and making rebooking frictionless will move your utilization rate more than any marketing campaign.
3. Service menu depth. A menu built around one or two signature treatments creates revenue bottlenecks when those services go out of season or demand shifts. Estheticians with a thoughtful range — core facials, chemical treatments, body treatments, specialty add-ons — can stay fully booked year-round by shifting promotion toward what’s timely. Sun damage treatments in fall, hydration-focused services in winter.
What the Most Profitable Estheticians Do Differently
They treat retail as a core service, not an afterthought. The most successful esthetician businesses — the ones clearing $150K+ solo — have retail product sales woven into the client experience from the moment someone sits in the chair. The facial ends with a specific recommendation for two products tailored to what was observed during the treatment, not a vague “you might want to try this.” Specificity converts. Vagueness doesn’t.
They also have waitlists, not open availability. Being fully booked 3 weeks out signals demand, justifies price increases, and actually makes marketing easier — because you’re communicating scarcity, not availability. The estheticians who stay fully booked get there by being excellent, yes, but also by managing their booking systems strategically: capping cancellations with deposit policies, actively asking for referrals from best clients, and raising prices annually rather than waiting until they “feel ready.”
The ones who struggle are the ones who trade time for money and only time for money. No retail, no packages, no referral incentives. They’re excellent technically but running a fully time-capped business. A $95 facial booked back to back all day is the ceiling. Products, packages, and referrals are how you break through it.
The Commission vs. Suite Rental Decision
New estheticians often start commission-based in a salon (35-50% of service revenue) because the overhead is zero and the client base exists. The ceiling is obvious: if you’re generating $80,000 in service revenue and keeping 45%, you net $36,000. Meanwhile, a solo suite rental at $900/month with the same client base keeps $79,100 minus expenses. The math almost always favors suite rental once you have a stable book of business.
The breakeven point is usually around 12-15 regular clients. Below that, commission makes sense — you need the salon’s foot traffic and infrastructure. Above that, the math tilts hard toward independence. Run your specific numbers in the calculator to find your exact crossover point.
Keep reading (related guides):
What Most People Get Wrong
The single biggest mistake is treating revenue as the headline number. Revenue is vanity — margin is sanity, and cash-in-bank is reality. Two operators with identical top-lines routinely end the year $80K apart in take-home, because one priced for volume and the other priced for sustainability. The calculator above forces you to surface that gap before it hits your bank account.
The second mistake is modeling a “best case” and planning around it. The number you should plan around is the 30th-percentile scenario — enough demand to matter, but slower than you hoped. If the business still covers your living expenses there, you have real margin of safety. If it only works in the 80th-percentile case, you are building on sand.
The third mistake is ignoring your time as a cost. If you would otherwise earn $55/hr at a day job and this operation pays you effectively $18/hr for 60-hour weeks, the gap is the real price of running it. Plug your opportunity cost into the calculator and the picture often flips.
How to Pressure-Test Your Numbers
Start with the calculator, then stress-test three levers independently:
- Pricing: What happens to your take-home if you raise prices 10%, but lose 15% of volume? Most operators are surprised to find net income goes up.
- Costs: What happens if your largest input cost rises 20%? This is not hypothetical — it is a typical 12-month swing in most industries.
- Volume: What happens at 70% of your planned volume for 90 days? If that still covers fixed costs, you have a real business. If not, the model is fragile.
Running the calculator three ways takes about ten minutes. The clarity on the other side of those ten minutes is usually the difference between a confident operating plan and guessing for another six months.
Frequently Asked Questions
How accurate is this calculator?
The underlying math uses industry-standard margin and cost ranges sourced from the Esthetician Revenue: What Owners Make vs. What You’d Expect space. Your actual numbers depend on location, seasonality, and operating style, so treat this as a directional benchmark, not a guarantee. The more precisely you enter your inputs, the tighter the output range becomes.
Can I save my results?
A free Digital Dashboard Hub account saves every scenario you run, lets you compare side-by-side, and unlocks the full dashboard with expense tracking and month-over-month charts. The 14-day trial includes the complete tool library — no credit card required to start.
Who is this tool for?
It’s built for anyone pressure-testing a real decision — existing operators auditing their margins, side-hustlers deciding whether to go full-time, and prospective owners trying to sanity-check a business plan before signing a lease. You do not need any accounting background to use it.
What should I do with the results?
Start by comparing the output against your current (or projected) monthly take-home. If the gap is big, walk back the inputs and identify which lever — pricing, volume, or cost structure — is doing the damage. That is usually where the highest-leverage fix lives.
The Bottom Line
Most operators lose money not because the math is impossible, but because they never actually ran it. Fifteen minutes with the calculator beats three months of guessing. Run your numbers, screenshot the output, and use it as the baseline for every pricing and cost decision over the next quarter.
When you are ready to go deeper, the full Digital Dashboard Hub workspace lets you save scenarios, track actuals month-over-month, and see the trend before problems compound. That is the version that actually compounds the effort — spreadsheets forgotten in a Google Drive folder do not.
Next Steps
- Run the calculator above with your best current estimates.
- Re-run it with a pessimistic scenario (lower volume, higher costs) and a stretch scenario (better pricing, more efficient ops).
- Screenshot all three outputs so you have a baseline to compare against when reality arrives.
- Revisit monthly — the number that matters is the one that changes with your real P&L.
Ready for the full dashboard?
Unlock all 255 tools across business, creator, and health workflows.
Andy Gaber is the founder of Digital Dashboard Hub, a suite of 255+ interactive financial, productivity, and wellness tools. He built DDH after getting frustrated with financial apps that gave outputs without context. Follow along for tool tutorials, revenue analytics breakdowns, and honest takes on personal finance.