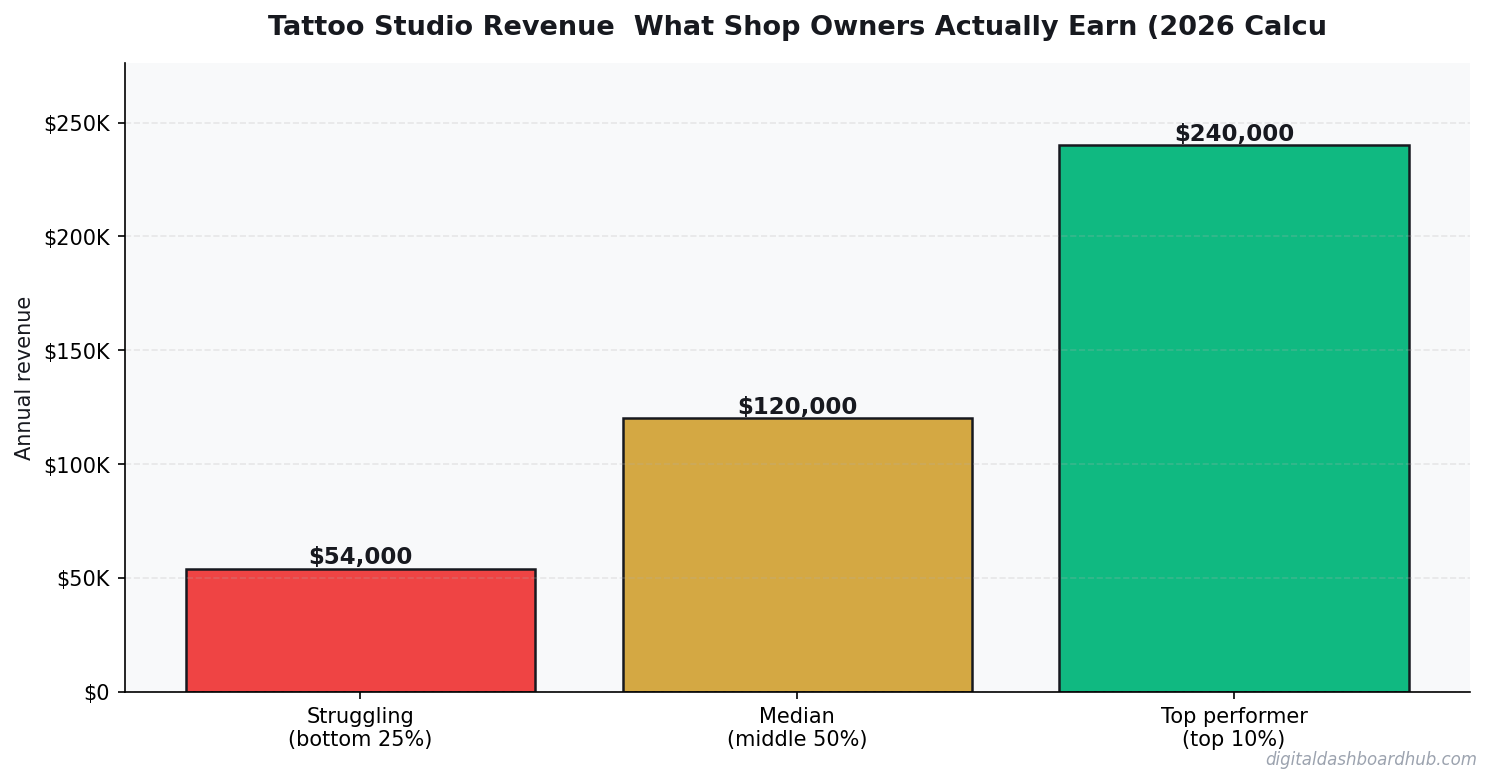
The average tattoo business generates $150,000-$350,000 in annual revenue, but owner take-home varies wildly based on location, pricing, and overhead management. I built a calculator that shows you the real numbers for your specific situation.
What Tattoo Business Owners Actually Make in 2026
The dashboard below loads instantly in your browser. Plug in your numbers, see your answer. No signup to try the basics.
Let’s kill the generic income claims. Here are the numbers that matter for a tattoo business:
Those numbers mean nothing without context, though. A tattoo business in Austin has different rent than one in rural Ohio. Your pricing strategy, service mix, and client retention rate determine whether you land at the top or bottom of that range.
Why Your Pricing Strategy Makes or Breaks Your Tattoo Business
Most tattoo business owners set prices by looking at what competitors charge and matching them. That’s a race to the middle that ignores your actual cost structure.
Here’s the math most people skip: if your overhead runs $6,000/month and you charge $150-$300 per service, you need a minimum client volume just to break even. Every dollar below that target is money you’re pulling from your own pocket.
The top-performing tattoo business businesses I’ve studied share three traits: they track revenue per service type, they know their cost per client acquisition, and they review their numbers monthly — not annually at tax time. If you’re interested in how other small business owners approach financial tracking, check out Personal Trainer Revenue Calculator: Solo vs. Studio vs. Online.
The Real Cost Breakdown Nobody Shows You
Here’s what eats into tattoo business revenue, ranked by impact:
| Expense Category | % of Revenue | Monthly ($10K revenue) |
|---|---|---|
| Rent/Lease | 15-25% | $1,500-$2,500 |
| Labor/Staff | 25-40% | $2,500-$4,000 |
| Supplies/Materials | 8-15% | $800-$1,500 |
| Insurance | 3-6% | $300-$600 |
| Marketing | 3-8% | $300-$800 |
| Owner Take-Home | 30-50% | $2,500-$4,500 |
That table is why generic “how much does a tattoo business make” articles are useless. Your specific expense ratios determine whether you’re building wealth or subsidizing your own employment.
How the DDH Tattoo Studio Revenue Calculator Works
Here’s what running your numbers looks like in practice.
Step 1: Enter your service prices and average weekly client count. The calculator maps your gross revenue instantly — no formulas to build, no spreadsheet headaches.
Step 2: Plug in your actual overhead: rent, labor cost per hour, supply expenses, insurance. The tool calculates your true net margin and shows where the money goes.
Step 3: Run “what-if” scenarios. What if you raised prices by $10? Added a second employee? Moved to a cheaper location? Each scenario shows the revenue impact in real time.
The feature that made this worth building: the profit per service breakdown. Most tattoo business owners offer 5-10 different services but have no idea which ones are actually profitable. This shows you exactly which services earn you money and which ones you’re doing at a loss.
If you want to try this yourself: Open the Tattoo Studio Revenue Calculator free → — 14-day trial, no credit card, takes about 60 seconds to set up.
3 Ways to Push Your Tattoo Business Revenue Higher
Raise prices strategically. A $5 increase on your most-booked service adds $100-$300/week with zero additional work. Most tattoo business owners haven’t raised prices in 2+ years despite rising costs. Related: How to Start a Mobile Service Business in 2026: Revenue Calculator for 7 Niches.
Track utilization rate. If your chairs, rooms, or trucks sit empty 30% of the time, that’s recoverable revenue. Calculate your capacity utilization — the number should be above 75%.
Cut your worst expense ratio. Look at your biggest line item (usually rent or labor) and find one way to reduce it by 10%. For most businesses, that’s $200-$600/month straight to your bottom line.
DDH vs Other Tattoo Business Revenue Tools
| Feature | Generic Spreadsheet | Industry Software | DDH Calculator |
|---|---|---|---|
| Industry-specific formulas | No | Yes | Yes |
| What-if scenarios | Manual only | Limited | Instant |
| Cost | Free (your time) | $30-$100/mo | Free trial |
| Setup time | 2-4 hours | 1-2 hours | 60 seconds |
| Profit per service | You build it | Some | Built-in |
Your Next Move
Right now (2 minutes): Write down your top 3 services and what you charge for each. If you can’t do this from memory, that’s your first problem.
This week: Pull your last 3 months of bank statements and calculate your actual overhead. Not what you think it is — what it really is.
The long play: Run your numbers through the DDH Tattoo Studio Revenue Calculator. It takes 60 seconds to set up, it’s free for 14 days, and you’ll walk away knowing exactly what your tattoo business needs to hit your income goal. There are 255+ tools in the platform — this is just one of them.
What Tattoo Artists Actually Earn: Breaking Down the Numbers
A mid-career tattoo artist working 5 days/week at a street shop in a mid-size city:
Daily output: 3-4 hours of actual tattooing at $175/hour average. Daily gross: $525-$700. Monthly: $11,000-$14,700. The artist keeps 50-60% after booth rent or shop split, netting $5,500-$8,800/month. That’s $66K-$105K annually — firmly middle-class to upper-middle, but with no benefits and unpredictable booking gaps.
Shop owners who also tattoo run completely different economics: higher overhead, but potentially $150K-$300K in revenue with the right location and staff.
The Revenue Variables No Calculator Can Fully Capture
Portfolio niche and demand. A fine-line specialist or watercolor artist has a two-to-three month waitlist at premium rates. A general “walk-in friendly” artist fills chairs faster but at lower rates with less control over their schedule. The best economics come from developing a recognizable style — social media does the marketing, demand drives rates up, and clients self-select based on aesthetic fit.
Minimum prices matter more than hourly rate. A $300 minimum means a 45-minute small tattoo generates the same revenue as a 2-hour session — but only one of those is worth your setup time. Artists who set clear minimums and hold them report dramatically better income-per-hour ratios than those who fill slow days with $80 flash pieces.
Merchandise and art prints. Artists with a strong following can add $500-$2,000/month in passive income through print-on-demand art prints, stickers, and apparel. It’s not transformative alone, but it monetizes the same following that drives booking demand.
Building a Waitlist Business: The Tattoo Artist’s Pricing Superpower
A 3-month waitlist is not a scheduling problem — it’s a pricing signal. When demand consistently outpaces availability, raising prices is the correct response. A 20% rate increase that reduces your waitlist from 3 months to 6 weeks while maintaining the same booking volume means you’re earning 20% more for the same work. The clients who leave because of price were probably not your ideal clients anyway.
The artists who resist raising prices when they have long waitlists are subsidizing everyone in their queue with their own time. There’s no ethical obligation to stay affordable when your work is in demand. Raise prices until your waitlist is 4-8 weeks — that’s the sweet spot between exclusivity and accessibility. Below that, you’re leaving money on the table. Above it, you’re losing bookings to impatience.
Managing Your Schedule for Maximum Hourly Revenue
Most tattoo artists have a default of booking wall-to-wall with whatever clients request — small pieces, touch-ups, consultations, big projects all mixed together. The artists earning the most per hour strategically batch their schedule: full-day large projects on certain days, shorter work on others. Large pieces at day-long rates generate better revenue per hour than four small pieces with four set-ups and consultations. Know your hourly rate by booking type and protect your high-revenue time slots accordingly.
Track your booking metrics monthly: total sessions, total hours tattooed, revenue per session, and revenue per hour. Most artists have a general sense of how they’re doing but no specific numbers. The artists who raise their rates with confidence are the ones who know their hourly rate, can see it improving over time, and can anchor any rate increase to specific data about their market position.
Keep reading (related guides):
255+ interactive tools for your money, time, and health.
Full dashboard access · Stripe-secure checkout · Cancel anytime
Keep Reading
- Personal Trainer Revenue Calculator: Solo vs. Studio vs. Online
- How to Start a Mobile Service Business in 2026: Revenue Calculator for 7 Niches
- Business Revenue Projection Calculator: Build a 12-Month Forecast
- Pet Business Revenue Calculator: Grooming, Boarding, or Training?
What Most People Get Wrong
The single biggest mistake is treating revenue as the headline number. Revenue is vanity — margin is sanity, and cash-in-bank is reality. Two operators with identical top-lines routinely end the year $80K apart in take-home, because one priced for volume and the other priced for sustainability. The calculator above forces you to surface that gap before it hits your bank account.
The second mistake is modeling a “best case” and planning around it. The number you should plan around is the 30th-percentile scenario — enough demand to matter, but slower than you hoped. If the business still covers your living expenses there, you have real margin of safety. If it only works in the 80th-percentile case, you are building on sand.
The third mistake is ignoring your time as a cost. If you would otherwise earn $55/hr at a day job and this operation pays you effectively $18/hr for 60-hour weeks, the gap is the real price of running it. Plug your opportunity cost into the calculator and the picture often flips.
How to Pressure-Test Your Numbers
Start with the calculator, then stress-test three levers independently:
- Pricing: What happens to your take-home if you raise prices 10%, but lose 15% of volume? Most operators are surprised to find net income goes up.
- Costs: What happens if your largest input cost rises 20%? This is not hypothetical — it is a typical 12-month swing in most industries.
- Volume: What happens at 70% of your planned volume for 90 days? If that still covers fixed costs, you have a real business. If not, the model is fragile.
Running the calculator three ways takes about ten minutes. The clarity on the other side of those ten minutes is usually the difference between a confident operating plan and guessing for another six months.
Frequently Asked Questions
How accurate is this calculator?
The underlying math uses industry-standard margin and cost ranges sourced from the Tattoo Studio Revenue: What Shop Owners Actually Earn space. Your actual numbers depend on location, seasonality, and operating style, so treat this as a directional benchmark, not a guarantee. The more precisely you enter your inputs, the tighter the output range becomes.
Can I save my results?
A free Digital Dashboard Hub account saves every scenario you run, lets you compare side-by-side, and unlocks the full dashboard with expense tracking and month-over-month charts. The 14-day trial includes the complete tool library — no credit card required to start.
Who is this tool for?
It’s built for anyone pressure-testing a real decision — existing operators auditing their margins, side-hustlers deciding whether to go full-time, and prospective owners trying to sanity-check a business plan before signing a lease. You do not need any accounting background to use it.
What should I do with the results?
Start by comparing the output against your current (or projected) monthly take-home. If the gap is big, walk back the inputs and identify which lever — pricing, volume, or cost structure — is doing the damage. That is usually where the highest-leverage fix lives.
The Bottom Line
Most operators lose money not because the math is impossible, but because they never actually ran it. Fifteen minutes with the calculator beats three months of guessing. Run your numbers, screenshot the output, and use it as the baseline for every pricing and cost decision over the next quarter.
When you are ready to go deeper, the full Digital Dashboard Hub workspace lets you save scenarios, track actuals month-over-month, and see the trend before problems compound. That is the version that actually compounds the effort — spreadsheets forgotten in a Google Drive folder do not.
Next Steps
- Run the calculator above with your best current estimates.
- Re-run it with a pessimistic scenario (lower volume, higher costs) and a stretch scenario (better pricing, more efficient ops).
- Screenshot all three outputs so you have a baseline to compare against when reality arrives.
- Revisit monthly — the number that matters is the one that changes with your real P&L.
Ready for the full dashboard?
Unlock all 255 tools across business, creator, and health workflows.
Andy Gaber is the founder of Digital Dashboard Hub, a suite of 255+ interactive financial, productivity, and wellness tools. He built DDH after getting frustrated with financial apps that gave outputs without context. Follow along for tool tutorials, revenue analytics breakdowns, and honest takes on personal finance.