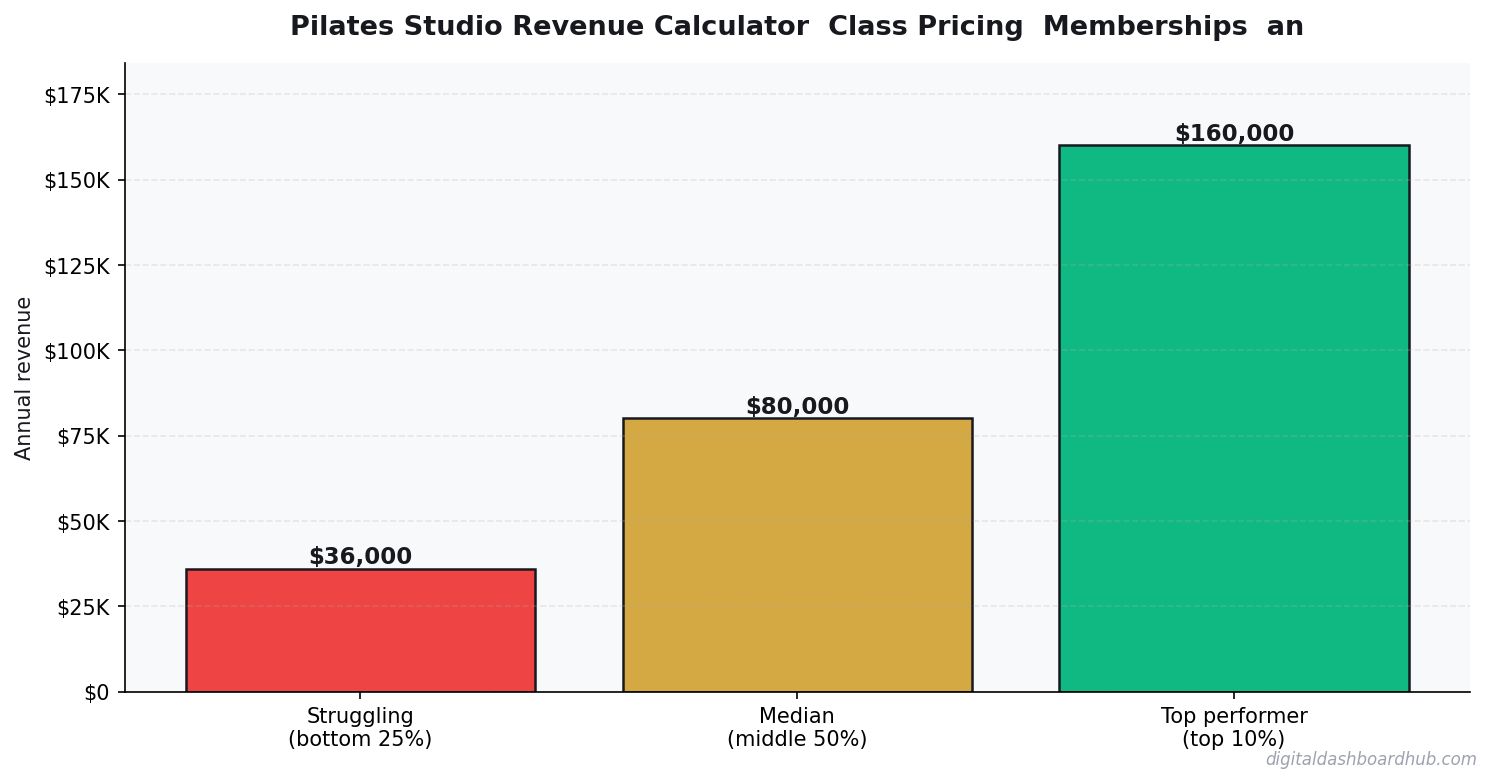
The average pilates studio generates $100,000-$300,000 in annual revenue, but owner take-home varies wildly based on location, pricing, and overhead management. I built a calculator that shows you the real numbers for your specific situation.
What Pilates Studio Owners Actually Make in 2026
Jump in: the tool below is live and free to play with. Upgrade to a dashboard account when you want to save scenarios and track over time.
Let’s kill the generic income claims. Here are the numbers that matter for a pilates studio:
Those numbers mean nothing without context, though. A pilates studio in Austin has different rent than one in rural Ohio. Your pricing strategy, service mix, and client retention rate determine whether you land at the top or bottom of that range.
Why Your Pricing Strategy Makes or Breaks Your Pilates Studio
Most pilates studio owners set prices by looking at what competitors charge and matching them. That’s a race to the middle that ignores your actual cost structure.
Here’s the math most people skip: if your overhead runs $6,000/month and you charge $25-$45 per service, you need a minimum client volume just to break even. Every dollar below that target is money you’re pulling from your own pocket.
The top-performing pilates studio businesses I’ve studied share three traits: they track revenue per service type, they know their cost per client acquisition, and they review their numbers monthly — not annually at tax time. If you’re interested in how other small business owners approach financial tracking, check out Personal Trainer Revenue Calculator: Solo vs. Studio vs. Online.
The Real Cost Breakdown Nobody Shows You
Here’s what eats into pilates studio revenue, ranked by impact:
| Expense Category | % of Revenue | Monthly ($10K revenue) |
|---|---|---|
| Rent/Lease | 15-25% | $1,500-$2,500 |
| Labor/Staff | 25-40% | $2,500-$4,000 |
| Supplies/Materials | 8-15% | $800-$1,500 |
| Insurance | 3-6% | $300-$600 |
| Marketing | 3-8% | $300-$800 |
| Owner Take-Home | 20-35% | $2,500-$4,500 |
That table is why generic “how much does a pilates studio make” articles are useless. Your specific expense ratios determine whether you’re building wealth or subsidizing your own employment.
How the DDH Pilates Studio Revenue Calculator Works
Here’s what running your numbers looks like in practice.
Step 1: Enter your service prices and average weekly client count. The calculator maps your gross revenue instantly — no formulas to build, no spreadsheet headaches.
Step 2: Plug in your actual overhead: rent, labor cost per hour, supply expenses, insurance. The tool calculates your true net margin and shows where the money goes.
Step 3: Run “what-if” scenarios. What if you raised prices by $10? Added a second employee? Moved to a cheaper location? Each scenario shows the revenue impact in real time.
The feature that made this worth building: the profit per service breakdown. Most pilates studio owners offer 5-10 different services but have no idea which ones are actually profitable. This shows you exactly which services earn you money and which ones you’re doing at a loss.
If you want to try this yourself: Open the Pilates Studio Revenue Calculator free → — 14-day trial, no credit card, takes about 60 seconds to set up.
3 Ways to Push Your Pilates Studio Revenue Higher
Raise prices strategically. A $5 increase on your most-booked service adds $100-$300/week with zero additional work. Most pilates studio owners haven’t raised prices in 2+ years despite rising costs. Related: Airbnb Revenue Calculator: How to Estimate Your Rental Income Before Buying.
Track utilization rate. If your chairs, rooms, or trucks sit empty 30% of the time, that’s recoverable revenue. Calculate your capacity utilization — the number should be above 75%.
Cut your worst expense ratio. Look at your biggest line item (usually rent or labor) and find one way to reduce it by 10%. For most businesses, that’s $200-$600/month straight to your bottom line.
DDH vs Other Pilates Studio Revenue Tools
| Feature | Generic Spreadsheet | Industry Software | DDH Calculator |
|---|---|---|---|
| Industry-specific formulas | No | Yes | Yes |
| What-if scenarios | Manual only | Limited | Instant |
| Cost | Free (your time) | $30-$100/mo | Free trial |
| Setup time | 2-4 hours | 1-2 hours | 60 seconds |
| Profit per service | You build it | Some | Built-in |
Your Next Move
Right now (2 minutes): Write down your top 3 services and what you charge for each. If you can’t do this from memory, that’s your first problem.
This week: Pull your last 3 months of bank statements and calculate your actual overhead. Not what you think it is — what it really is.
The long play: Run your numbers through the DDH Pilates Studio Revenue Calculator. It takes 60 seconds to set up, it’s free for 14 days, and you’ll walk away knowing exactly what your pilates studio needs to hit your income goal. There are 255+ tools in the platform — this is just one of them.
A Real Pilates Studio by the Numbers
Here’s the math on a reformer studio in Denver with 8 reformers and 3 instructors (1 full-time, 2 part-time).
They run 6 private sessions daily at $95 each, plus 4 small group reformer classes (6 students, $45/head). That’s $570 from privates and $1,080 from groups — $1,650/day at full booking. At 80% utilization, monthly gross: ~$26,400.
Instructor cost at 35% rev share: $9,240. Rent (1,800 sq ft): $4,200. Insurance, software, supplies: $1,400. Owner take-home before tax: ~$11,560/month. That’s the ceiling scenario. Most studios run 55–65% utilization and earn 60–70% of that figure.
The 3 Factors That Move Pilates Revenue Most
- Private vs. group mix. Privates generate more per session but cap at one client per reformer. Groups fill the same hardware with 5–6x the revenue per hour. Studios running 70%+ group classes typically outperform private-heavy studios by 30–40% on total revenue — though group client retention requires more active management.
- Equipment utilization. An idle reformer is pure opportunity cost. Subcontracting equipment time to freelance instructors during off-peak hours can add $1,500–$2,500/month with zero additional overhead.
- Package structure. Single-session drop-ins average $95, but a 10-pack at $850 locks in $85/session AND $850 upfront. Studios that default clients into packages see 25–40% higher lifetime value than drop-in-first studios.
What Break-Even Actually Requires
For an 8-reformer studio, break-even is typically $14,000–$18,000/month depending on rent. At $85/session average, that’s 165–210 sessions per month — roughly 6–8 full sessions per reformer per day.
That’s achievable. But you need 18–24 months to build the client base. Most studios that close do so at month 8–12, just before they would have crossed break-even. The ones that make it almost always have a waitlist strategy from day one — the psychological signal of a waitlist accelerates word-of-mouth faster than any advertising budget.
Run your numbers through the calculator above. If you’re not hitting targets, look at group class fill rate first — it’s typically the fastest lever available without adding marketing spend.
Keep reading (related guides):
255+ interactive tools for your money, time, and health.
Instant signup · Stripe-secure · Cancel in one click
Keep Reading
- Personal Trainer Revenue Calculator: Solo vs. Studio vs. Online
- Airbnb Revenue Calculator: How to Estimate Your Rental Income Before Buying
- How Much Does a Hair Salon Make? (2026 Revenue Calculator)
- How Much Does a Flooring Install Make? (2026 Revenue Calculator)
What Most People Get Wrong
The single biggest mistake is treating revenue as the headline number. Revenue is vanity — margin is sanity, and cash-in-bank is reality. Two operators with identical top-lines routinely end the year $80K apart in take-home, because one priced for volume and the other priced for sustainability. The calculator above forces you to surface that gap before it hits your bank account.
The second mistake is modeling a “best case” and planning around it. The number you should plan around is the 30th-percentile scenario — enough demand to matter, but slower than you hoped. If the business still covers your living expenses there, you have real margin of safety. If it only works in the 80th-percentile case, you are building on sand.
The third mistake is ignoring your time as a cost. If you would otherwise earn $55/hr at a day job and this operation pays you effectively $18/hr for 60-hour weeks, the gap is the real price of running it. Plug your opportunity cost into the calculator and the picture often flips.
How to Pressure-Test Your Numbers
Start with the calculator, then stress-test three levers independently:
- Pricing: What happens to your take-home if you raise prices 10%, but lose 15% of volume? Most operators are surprised to find net income goes up.
- Costs: What happens if your largest input cost rises 20%? This is not hypothetical — it is a typical 12-month swing in most industries.
- Volume: What happens at 70% of your planned volume for 90 days? If that still covers fixed costs, you have a real business. If not, the model is fragile.
Running the calculator three ways takes about ten minutes. The clarity on the other side of those ten minutes is usually the difference between a confident operating plan and guessing for another six months.
Frequently Asked Questions
How accurate is this calculator?
The underlying math uses industry-standard margin and cost ranges sourced from the Pilates Studio Revenue Calculator: Class Pricing, Memberships, and Profit Margins space. Your actual numbers depend on location, seasonality, and operating style, so treat this as a directional benchmark, not a guarantee. The more precisely you enter your inputs, the tighter the output range becomes.
Can I save my results?
A free Digital Dashboard Hub account saves every scenario you run, lets you compare side-by-side, and unlocks the full dashboard with expense tracking and month-over-month charts. The 14-day trial includes the complete tool library — no credit card required to start.
Who is this tool for?
It’s built for anyone pressure-testing a real decision — existing operators auditing their margins, side-hustlers deciding whether to go full-time, and prospective owners trying to sanity-check a business plan before signing a lease. You do not need any accounting background to use it.
What should I do with the results?
Start by comparing the output against your current (or projected) monthly take-home. If the gap is big, walk back the inputs and identify which lever — pricing, volume, or cost structure — is doing the damage. That is usually where the highest-leverage fix lives.
The Bottom Line
Most operators lose money not because the math is impossible, but because they never actually ran it. Fifteen minutes with the calculator beats three months of guessing. Run your numbers, screenshot the output, and use it as the baseline for every pricing and cost decision over the next quarter.
When you are ready to go deeper, the full Digital Dashboard Hub workspace lets you save scenarios, track actuals month-over-month, and see the trend before problems compound. That is the version that actually compounds the effort — spreadsheets forgotten in a Google Drive folder do not.
Next Steps
- Run the calculator above with your best current estimates.
- Re-run it with a pessimistic scenario (lower volume, higher costs) and a stretch scenario (better pricing, more efficient ops).
- Screenshot all three outputs so you have a baseline to compare against when reality arrives.
- Revisit monthly — the number that matters is the one that changes with your real P&L.
What the Numbers Actually Mean
Revenue, profit, and take-home pay tell three completely different stories, and conflating them is the fastest way to build a business plan that blows up on contact with reality. Revenue is the gross — what shows up on invoices and receipts before anyone pays anyone else. Profit is what remains after the cost of actually producing the service or product. Take-home is what lands in your personal account after taxes, self-employment contributions, benefits, and reinvestment.
The calculator above is specifically tuned to show the delta between those three layers, because that delta is where most operators get blindsided. A business can look like it is doing $400K/year and still pay its owner less than a middle-manager’s salary if the cost structure is wrong. Conversely, a modest $180K/year operation with disciplined costs can out-earn the flashy one in actual cash delivered to the owner’s household.
When you run your scenario, pay the most attention to the “after taxes and reinvestment” line rather than the top-line number. That is the line that determines whether this is a real livelihood or a time-expensive hobby that looks successful on Instagram.
Using the Tool With Your Own Data
The calculator delivers the most honest answer when you plug in real numbers from the last 90 days rather than aspirational ones. If you do not have 90 days of data yet, use the lowest plausible input for volume, the highest plausible input for each cost, and then run it again with your “most likely” estimates. The gap between those two runs is your planning buffer — that is the margin you have before you are in trouble.
Operators who do this exercise quarterly tend to outperform operators who only run the numbers once at the start and then reference outdated assumptions for the next 18 months. Markets change, input costs change, and your own operational efficiency changes. A static plan is a decaying one. Ten minutes with the calculator every quarter is enough to catch most problems while there is still runway to fix them.
If you are comparing two different business models or two pricing strategies, duplicate the scenario, change one variable, and compare. Isolating a single lever is how you learn which change actually moved the needle — this is the same approach good product teams use for A/B tests, and it applies to running a small business just as cleanly.
When to Revisit This
Come back to the calculator whenever one of these things changes: your pricing, your largest input cost, your volume (up or down by more than 20%), or your tax situation. Each of those variables moves the take-home line enough that the plan you had last quarter may no longer be the plan you need this quarter. Put a recurring 30-minute block on your calendar for the first week of every quarter and run the scenario fresh — it is the single highest-leverage business habit you can build.
Save your screenshots in a single folder labeled by date so you can see the trend across time. That folder becomes a ruthless honesty mirror when you are tempted to invest in growth spending or take on new fixed costs — does the next quarter actually support that move, or is it wishful thinking?
Ready for the full dashboard?
Unlock all 255 tools across business, creator, and health workflows.
Andy Gaber is the founder of Digital Dashboard Hub, a suite of 255+ interactive financial, productivity, and wellness tools. He built DDH after getting frustrated with financial apps that gave outputs without context. Follow along for tool tutorials, revenue analytics breakdowns, and honest takes on personal finance.