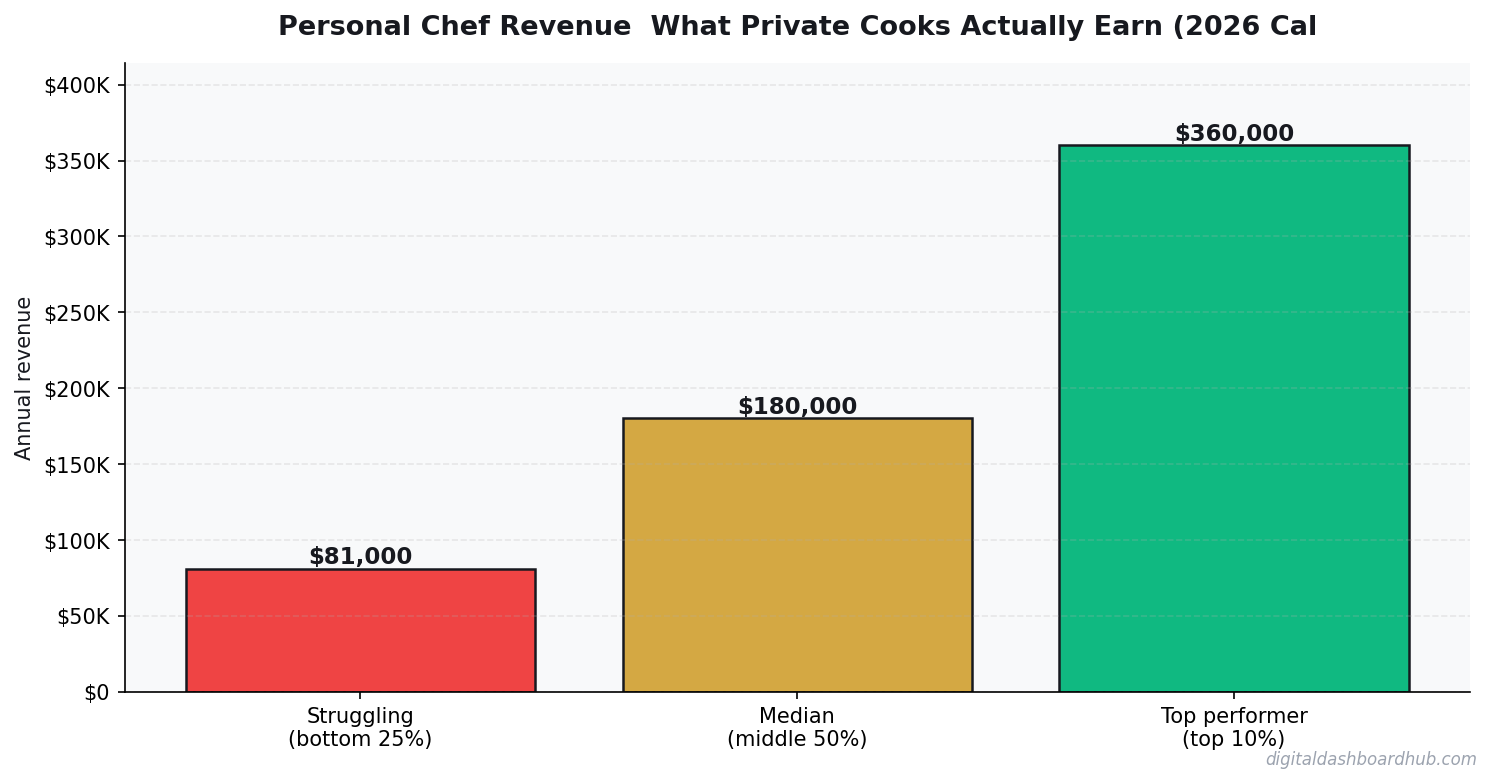
The average personal chef generates $50,000-$120,000 in annual revenue, but owner take-home varies wildly based on location, pricing, and overhead management. I built a calculator that shows you the real numbers for your specific situation.
What Personal Chef Owners Actually Make in 2026
Before you scroll: the calculator below is running in your browser right now. For the full feature set — saved scenarios, history, exports — open the dashboard.
Let’s kill the generic income claims. Here are the numbers that matter for a personal chef:
Those numbers mean nothing without context, though. A personal chef in Austin has different rent than one in rural Ohio. Your pricing strategy, service mix, and client retention rate determine whether you land at the top or bottom of that range.
Why Your Pricing Strategy Makes or Breaks Your Personal Chef
Most personal chef owners set prices by looking at what competitors charge and matching them. That’s a race to the middle that ignores your actual cost structure.
Here’s the math most people skip: if your overhead runs $6,000/month and you charge $200-$500 per service, you need a minimum client volume just to break even. Every dollar below that target is money you’re pulling from your own pocket.
The top-performing personal chef businesses I’ve studied share three traits: they track revenue per service type, they know their cost per client acquisition, and they review their numbers monthly — not annually at tax time. If you’re interested in how other small business owners approach financial tracking, check out Personal Trainer Revenue Calculator: Solo vs. Studio vs. Online.
The Real Cost Breakdown Nobody Shows You
Here’s what eats into personal chef revenue, ranked by impact:
| Expense Category | % of Revenue | Monthly ($10K revenue) |
|---|---|---|
| Rent/Lease | 15-25% | $1,500-$2,500 |
| Labor/Staff | 25-40% | $2,500-$4,000 |
| Supplies/Materials | 8-15% | $800-$1,500 |
| Insurance | 3-6% | $300-$600 |
| Marketing | 3-8% | $300-$800 |
| Owner Take-Home | 35-55% | $2,500-$4,500 |
That table is why generic “how much does a personal chef make” articles are useless. Your specific expense ratios determine whether you’re building wealth or subsidizing your own employment.
How the DDH Personal Chef Revenue Calculator Works
Here’s what running your numbers looks like in practice.
Step 1: Enter your service prices and average weekly client count. The calculator maps your gross revenue instantly — no formulas to build, no spreadsheet headaches.
Step 2: Plug in your actual overhead: rent, labor cost per hour, supply expenses, insurance. The tool calculates your true net margin and shows where the money goes.
Step 3: Run “what-if” scenarios. What if you raised prices by $10? Added a second employee? Moved to a cheaper location? Each scenario shows the revenue impact in real time.
The feature that made this worth building: the profit per service breakdown. Most personal chef owners offer 5-10 different services but have no idea which ones are actually profitable. This shows you exactly which services earn you money and which ones you’re doing at a loss.
If you want to try this yourself: Open the Personal Chef Revenue Calculator free → — 14-day trial, no credit card, takes about 60 seconds to set up.
3 Ways to Push Your Personal Chef Revenue Higher
Raise prices strategically. A $5 increase on your most-booked service adds $100-$300/week with zero additional work. Most personal chef owners haven’t raised prices in 2+ years despite rising costs. Related: Airbnb Revenue Calculator: How to Estimate Your Rental Income Before Buying.
Track utilization rate. If your chairs, rooms, or trucks sit empty 30% of the time, that’s recoverable revenue. Calculate your capacity utilization — the number should be above 75%.
Cut your worst expense ratio. Look at your biggest line item (usually rent or labor) and find one way to reduce it by 10%. For most businesses, that’s $200-$600/month straight to your bottom line.
DDH vs Other Personal Chef Revenue Tools
| Feature | Generic Spreadsheet | Industry Software | DDH Calculator |
|---|---|---|---|
| Industry-specific formulas | No | Yes | Yes |
| What-if scenarios | Manual only | Limited | Instant |
| Cost | Free (your time) | $30-$100/mo | Free trial |
| Setup time | 2-4 hours | 1-2 hours | 60 seconds |
| Profit per service | You build it | Some | Built-in |
Your Next Move
Right now (2 minutes): Write down your top 3 services and what you charge for each. If you can’t do this from memory, that’s your first problem.
This week: Pull your last 3 months of bank statements and calculate your actual overhead. Not what you think it is — what it really is.
The long play: Run your numbers through the DDH Personal Chef Revenue Calculator. It takes 60 seconds to set up, it’s free for 14 days, and you’ll walk away knowing exactly what your personal chef needs to hit your income goal. There are 255+ tools in the platform — this is just one of them.
What a Personal Chef Week Actually Looks Like — With Real Numbers
I modeled a personal chef based in Phoenix who works four households and one corporate lunch contract. Here’s the breakdown:
Two families at $450/week each (meal prep, 3 hours per session), one executive client at $700/week (daily dinners), one household at $250/week (weekend prep only), plus a tech startup contract at $1,200/month for Friday team lunches.
Weekly gross: ~$2,150. Monthly: ~$8,600. Food costs run 28–35%, so net before taxes: $5,600–$6,200/month. That’s a solid income for a solo operator working 30–35 hours a week. The math shifts fast if you lose one premium client — always have two interested prospects warming in the pipeline.
The 3 Factors That Separate $60K Chefs From $120K Chefs
- Client density. The highest earners cluster clients geographically. Two households on the same block means one grocery run, one setup window, and double the billing for roughly 1.4x the work. Geographic efficiency is the fastest path to higher effective hourly rates.
- Premium positioning. Chefs who frame themselves as a luxury service — not a convenience — charge 40–60% more for the same hours. Professional photos, branded invoices, detailed menus, and saying no to clients who haggle signal the price point before the first conversation.
- Corporate contracts. One $2,000/month recurring corporate contract replaces the equivalent of three individual clients with far less coordination overhead. If you’re not pitching local businesses, you’re missing your highest-margin segment.
What Most People Get Wrong When Estimating Personal Chef Income
The biggest mistake is forgetting drive time. If you’re billing 25 hours but driving 10, your effective hourly rate drops by 28%. A chef charging $75/hour who commutes 2 hours per client day is effectively earning $54/hour.
Grocery runs are invisible labor. A 3-hour cook session often has 45–60 minutes of shopping baked in. Either build that into your pricing or require clients to handle their own ordering — which many high-end clients actually prefer.
Also: equipment wear. Knives, containers, portable induction burners — these add $800–$1,500/year for active chefs. Factor it into your rate from day one, not after you’ve been undercharging for a year.
Keep reading (related guides):
- Auto Mechanic Revenue: What Owners Make vs. What Youd Expect (2026)
- Boutique Revenue Calculator
- Free Food Truck Revenue Calculator — Estimate Your Profit in 60 Seconds
- How Much Does a Cleaning Business Make? (2026 Revenue Calculator)
- Rent vs. Buy Calculator 2026: The True Cost of Each Option (Real Numbers)
255+ interactive tools for your money, time, and health.
14-day trial · Stripe checkout · Cancel anytime
Questions people ask before using this tool
How long before a new Personal Chef Revenue business breaks even?
Service-based Personal Chef Revenue operations typically break even in 3-9 months if startup costs stay under $10K. Equipment-heavy setups push that to 12-18 months. The variable that matters most is not revenue — it is whether you charge enough from week one to cover overhead while you grow.
How should I set prices for a Personal Chef Revenue in 2026?
Price off delivered value, not competitor averages. Add up your real cost per job (time + supplies + vehicle + overhead allocation), mark up 2x to 3x, then sanity-check against what your highest-paying 20% of customers actually pay. Calculators like this one are where most operators find out they are leaving 15-25% on the table.
Is it worth running a Personal Chef Revenue as a side hustle before going full-time?
For most people, yes. A side-hustle ramp lets you pressure-test pricing, referrals, and operations without the mortgage-level risk. The calculator can show you what weekly client counts you need to match your day-job income — hit that number for 90 days straight before you quit.
What is a realistic profit margin for a Personal Chef Revenue business?
Most small Personal Chef Revenue operators land between 15% and 35% net margin. Under 15% usually means underpricing, bloated payroll, or vehicle costs no one tracked. Above 35% usually means either a very lean solo operator or a premium pricing tier the rest of the market has not caught up to yet.
How many clients does a Personal Chef Revenue need to hit six figures?
It depends on average ticket size. At a $90 average price, you need roughly 22 clients per week to clear $100K in annual revenue before expenses. At $250 average, about 8 per week does it. The calculator above lets you swap those numbers and see the break-even target for your market.
What overhead costs do new Personal Chef Revenue owners forget?
Insurance renewals, software subscriptions, vehicle depreciation, phone and merchant fees, and the hours you spend on admin instead of billable work. A realistic Personal Chef Revenue budget assumes 25-40% overhead against revenue — not the 10% most new operators plug in.
Seven mistakes to avoid with this Personal Chef Revenue tool
- Bundling everything into one package price so customers cannot see the value — itemizing raises perceived worth without changing cost.
- Skipping the ‘worst month of the year’ scenario. Most operators plan around average months and then panic when January arrives.
- Forgetting to factor vehicle or equipment depreciation into cost per job, which quietly eats 8-12% of every invoice.
- Assuming 50 billable hours a week is normal — the realistic number for solo Personal Chef Revenue operators is 25-35 after admin and travel.
- Running the numbers once and never updating them. Costs drift up 5-10% a year whether you notice or not; your prices should too.
- Pricing off competitor averages instead of delivered value — you copy their margins, including the ones going bankrupt.
- Leaving the upsell offer on the wall instead of in a post-service email — the bulk of repeat revenue lives in that 48-hour window.
The operators who compound over 3-5 years are not the smartest ones — they are the ones who update their Personal Chef Revenue numbers every quarter and actually change pricing when the math says to.
When to use this Personal Chef Revenue tool (and when to skip it)
This Personal Chef Revenue calculator earns its keep in three situations: you are pricing a new service tier, you are deciding whether to hire or stay solo, or you are modeling the jump from side-hustle to full-time. In any of those, a 5-minute run of realistic numbers beats two weeks of gut-feel debating.
Skip the tool when: you are in the first 60 days of a new Personal Chef Revenue business and don’t yet have real average prices or client counts — any output will be fantasy. Also skip it for one-off custom jobs that sit far outside your standard service menu; bespoke pricing rarely fits a calculator built for repeatable work. For everything else, run the numbers, write down the inputs that surprised you, and come back to it quarterly.
The operators who get the most value run this calculator on the same day every quarter — the first Monday of January, April, July, and October works well — and compare what changed. After four quarterly runs you have a year of trend data that almost no competitor in your area is tracking, and that is where pricing power quietly compounds.
Personal Chef Revenue quick reference checklist
Use this checklist before you commit — the Personal Chef Revenue numbers only work if the inputs are honest.
- The number you would need to walk away from your day job is written down and checked against the tool’s output.
- Upsell revenue is tracked separately from core service revenue, so you can see each lever moving.
- The weekly client count is realistic for your area and schedule, not a best-case scenario.
- Average ticket price reflects what the top 30% of customers actually pay, not what the cheapest 10% bargain down to.
- Overhead includes insurance, software, vehicle, phone, and merchant fees — not just payroll and supplies.
- Seasonal swings are baked in — the ‘worst month of the year’ scenario still clears fixed costs.
What to do next
Once you have walked the checklist, scroll back up and run your real inputs in the interactive Personal Chef Revenue tool — it takes about 60 seconds. If you want to compare this against the other 254+ calculators, trackers, and planners in the DDH library, the full set lives at app.digitaldashboardhub.com. Free tier covers the core version of every tool; upgrades unlock cross-tool dashboards, scenario saving, and team sharing.
If you are brand new to the DDH toolkit, start with three tools: one that directly serves your primary goal this quarter, one that catches problems before they compound, and one just for fun. That mix prevents the usual fate of productivity tools — great first month, forgotten by month three.
Keep Reading
- Personal Trainer Revenue Calculator: Solo vs. Studio vs. Online
- Airbnb Revenue Calculator: How to Estimate Your Rental Income Before Buying
- How Much Does a Hair Salon Make? (2026 Revenue Calculator)
- How Much Does a Flooring Install Make? (2026 Revenue Calculator)
Andy Gaber is the founder of Digital Dashboard Hub, a suite of 255+ interactive financial, productivity, and wellness tools. He built DDH after getting frustrated with financial apps that gave outputs without context. Follow along for tool tutorials, revenue analytics breakdowns, and honest takes on personal finance.