A salon owner I know books 8 clients a day at an $85 average ticket. On paper that looks like $680 a day, $3,400 a week, a hair under $180,000 a year. She feels busy. She feels successful. Then you subtract her chair rent, the product cost on every color service, the 2.9% the card processor skims off every swipe, the Tuesday where only three people came in, and the no-show from Thursday who never rebooked. The number she actually takes home is closer to half of what the top-line looks like.
If you’ve Googled “how much does a hair salon make,” you already know the answers are all over the map. Some sites say $50K. Some say $500K. Both are right, depending on who you’re measuring. The real answer lives in your numbers — your ticket, your chair utilization, your service mix, your overhead model — and that’s what the calculator below actually solves for.
Try the Hair Salon Revenue Calculator
I’m Andy, founder of Digital Dashboard Hub. I built this calculator after that salon owner I mentioned told me she had her best revenue year ever and still barely paid herself. She had no way to see, in one view, where the money was actually going. So I made one. Plug in your numbers below — it updates instantly, no signup needed.
The Industry Numbers Nobody Quotes Honestly
Here’s the reality behind the averages. A single-chair salon in the U.S. typically grosses between $120,000 and $200,000 a year. Multi-chair salons scale from there — but the per-chair revenue rarely moves. What changes is how much of that gross you keep.
Net profit margins vary wildly based on the business model you run:
- Booth-rental salons: 8–15% net margin. You collect rent, you don’t pay stylists, but you also don’t capture the service revenue — just the rent check.
- Commission salons: 15–25% net margin. You pay 40–55% of service revenue to your stylists, but you keep the rest of the pie and control pricing.
- Product-heavy salons: 35–45% net margin. If you can push retail to 15–20% of total revenue, the margins on a $28 bottle of shampoo are obscene compared to a $90 haircut.
And the single biggest revenue lever in any of these models? Client retention. The industry average hovers around 40–60%, which means most salons lose half their clients every year and have to replace them from scratch. Acquiring a new salon client costs roughly 5x what it costs to keep an existing one. Most owners don’t track retention at all.
How the DDH Calculator Breaks Down Your Revenue
The calculator above runs three steps behind the scenes:
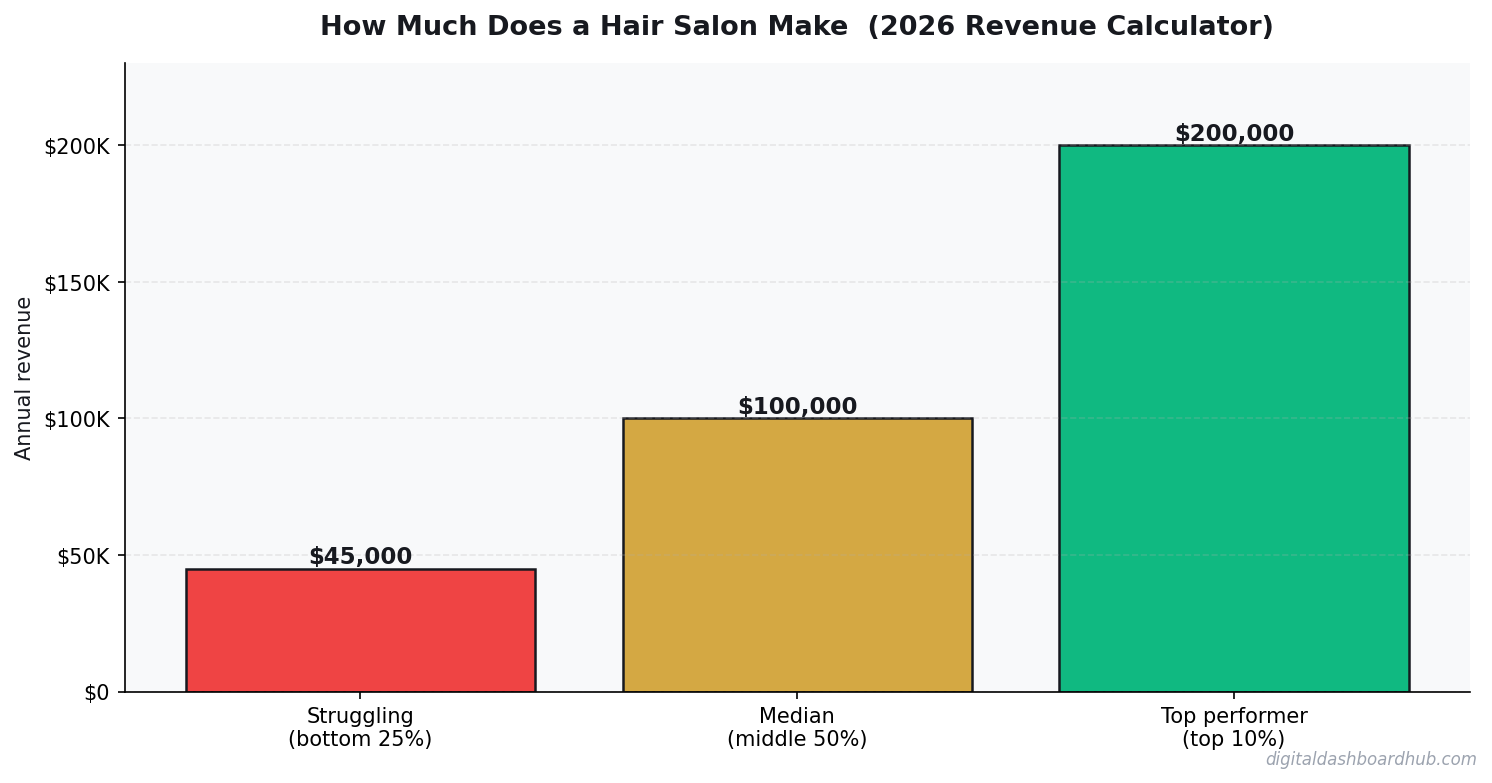
- Enter your average ticket and clients per week. This gives the gross revenue projection — the headline number most owners fixate on. Real-world tickets range from $28 for a basic cut to $250+ for a full highlight-and-color combo.
- Set your service mix and overhead percentage. A cuts-only salon has very different economics than a color-heavy one. Color and chemical services have 20–30% product cost built in; cuts have almost none. Overhead (rent, utilities, insurance, software, card fees) typically eats 55–70% of gross for commission salons.
- See monthly revenue, annual projection, and actual profit. That last number is the one you live on. It’s also the one most salon owners have never calculated honestly.
This is the same math framework I recommend when analyzing real income vs projected income for any small business — gross looks great, the gap between gross and take-home is where people get surprised.
Booth Rental vs. Commission vs. Suite — The Business Model Comparison
Before you can calculate “how much does a hair salon make,” you need to pick which kind of salon you’re asking about. Here’s the honest comparison:
| Model | Startup Cost | Owner Risk | Earning Ceiling | Best For |
|---|---|---|---|---|
| Booth Rental | $80K–$150K | Low—predictable rent income | Capped at chair count × weekly rent | Owners who don’t want to manage stylists |
| Commission | $100K–$250K | High—you carry payroll and slow weeks | Uncapped—scales with team + retail | Operators who want to build a brand |
| Suite/Independent | $5K–$25K | All on you—one chair, one income | Capped by your own hours | Solo stylists with an established book |
I’ve watched stylists leave booth-rental setups to run solo suites and double their take-home without touching their gross. I’ve also watched commission-salon owners crack $800K in revenue and clear less than a stylist working in a suite. The model you pick matters more than the hours you work.
The Contrarian Take: You’re Asking the Wrong Question
Most salon revenue calculators ask: how many clients can you handle per week? That’s the wrong question. The right one is: how many clients do you need to retain?
Run the math. A client with a $95 average ticket who comes in every 6 weeks is worth $820 a year. If you retain her for 4 years, she’s a $3,280 client. If you have to replace her every 10 months, you just burned 5x the cost of retention bringing in her replacement — who might churn too.
This is why my free lite calculator focuses on weekly client counts, but the full Hair Salon Revenue Calculator inside DDH layers in retention rate, rebook rate, and client lifetime value. Those three numbers are where salon owners actually win or lose — not ticket size.
A Real Example: The 6-Stylist Commission Salon
Let’s run a specific one so you can see how quickly a “big” salon turns into a modest paycheck.
A commission salon with 6 stylists, 85% chair utilization, $90 average ticket, 220 working days a year does the math like this:
- Stylist capacity: 6 stylists × 8 clients/day × 85% utilization = 40.8 clients/day
- Daily gross: 40.8 × $90 = $3,672
- Annual gross: $3,672 × 220 = $807,840
Looks great. Now subtract reality:
- Rent at $8K/month: $96,000
- Product & color cost at $15K/month: $180,000
- Stylist commissions (55% of service revenue): $444,312
- Utilities, insurance, software, supplies: $36,000
- Credit card processing (2.9%): $23,427
Total costs: $779,739. Net profit: $28,101. That’s a 3.5% margin on a salon most people would describe as “really successful.” Even if she runs her product mix up to 15% of revenue and tightens commission splits to 50%, she gets to roughly $87K/year net — a 10.9% margin. That’s the realistic ceiling for an owner-operated commission salon, and it’s why tracking every business expense matters more than chasing top-line growth.
It’s also why owner-stylists who go suite-model frequently take home more than multi-chair owners. They skip the payroll line entirely.
The Cash Flow Trap Nobody Warns You About
Salon revenue is lumpy. December books packed, January dies, February creeps back, March returns to normal. Summer in a college town empties out. Holidays in a family market triple. If you spend January money based on December revenue, you’re one slow quarter from a crisis.
I wrote about what happens when small business cash flow breaks down — and the pattern is identical across freelancers, Etsy sellers, and salon owners. Good year, no tax reserve, bad Q1, insolvency. The fix is the same every time: building a savings buffer on variable income — specifically, 3 months of fixed operating costs (rent, insurance, minimum payroll, loan payments) sitting in a separate account untouched.
If you’re trying to decide whether salon ownership even makes sense versus just staying on W-2, I put the math side by side in self-employed vs W-2 income comparison. Short version: ownership wins on ceiling, loses on predictability.
Your 3-Step Action Plan
- Today (10 minutes): Run your real numbers through the calculator above. Use the last 4 weeks of your actual data from your POS or bank statements, not estimates. Note where the profit number lands.
- This week: Pull your client retention rate. Count how many of your top 20 revenue clients from 12 months ago are still booking with you. If it’s under 14, retention is your bottleneck — not pricing, not marketing, not ticket size.
- This month: Start a free 14-day trial of the full DDH dashboard. Log your weekly numbers and watch the 3-month trend emerge. You’ll spot the pattern in your own revenue you’ve been missing — and that’s where the 2x profit hides.
Common Questions About Hair Salon Revenue
Is $200K a year realistic for a single-chair salon?
Yes, but only at the high end. A single stylist charging $120+ average tickets, booked 5 days a week, 45 weeks a year, with a 70%+ rebook rate can clear $200K gross. Take-home after rent, supplies, and taxes typically lands in the $90K–$130K range depending on overhead.
What’s a healthy chair utilization rate?
Industry benchmark is 70%. Under 60% and you have a booking problem. Over 85% and you’re leaving money on the table by not raising prices or hiring.
How fast can I see results from tracking these numbers?
Most salon owners spot their biggest leak within the first 30 days of consistent tracking. The common ones: card fees on small tickets, product cost creep on color services, and no-show rate concentrated on specific days. Once you see it, you can fix it in a week.
Do I need specialized software to track this?
Not to start. The calculator above runs the core math. But once you want historical trends, scenario modeling, and PDF reports for lenders or partners, the full DDH toolkit handles it in one dashboard — plus 254 other calculators in the same subscription.
Keep reading (related guides):
255+ interactive tools for your money, time, and health.
Full features for 14 days · Secure payment · Stop anytime
What Most People Get Wrong
The single biggest mistake is treating revenue as the headline number. Revenue is vanity — margin is sanity, and cash-in-bank is reality. Two operators with identical top-lines routinely end the year $80K apart in take-home, because one priced for volume and the other priced for sustainability. The calculator above forces you to surface that gap before it hits your bank account.
The second mistake is modeling a “best case” and planning around it. The number you should plan around is the 30th-percentile scenario — enough demand to matter, but slower than you hoped. If the business still covers your living expenses there, you have real margin of safety. If it only works in the 80th-percentile case, you are building on sand.
The third mistake is ignoring your time as a cost. If you would otherwise earn $55/hr at a day job and this operation pays you effectively $18/hr for 60-hour weeks, the gap is the real price of running it. Plug your opportunity cost into the calculator and the picture often flips.
How to Pressure-Test Your Numbers
Start with the calculator, then stress-test three levers independently:
- Pricing: What happens to your take-home if you raise prices 10%, but lose 15% of volume? Most operators are surprised to find net income goes up.
- Costs: What happens if your largest input cost rises 20%? This is not hypothetical — it is a typical 12-month swing in most industries.
- Volume: What happens at 70% of your planned volume for 90 days? If that still covers fixed costs, you have a real business. If not, the model is fragile.
Running the calculator three ways takes about ten minutes. The clarity on the other side of those ten minutes is usually the difference between a confident operating plan and guessing for another six months.
Frequently Asked Questions
How accurate is this calculator?
The underlying math uses industry-standard margin and cost ranges sourced from the How Much Does a Hair Salon Make? space. Your actual numbers depend on location, seasonality, and operating style, so treat this as a directional benchmark, not a guarantee. The more precisely you enter your inputs, the tighter the output range becomes.
Can I save my results?
A free Digital Dashboard Hub account saves every scenario you run, lets you compare side-by-side, and unlocks the full dashboard with expense tracking and month-over-month charts. The 14-day trial includes the complete tool library — no credit card required to start.
Who is this tool for?
It’s built for anyone pressure-testing a real decision — existing operators auditing their margins, side-hustlers deciding whether to go full-time, and prospective owners trying to sanity-check a business plan before signing a lease. You do not need any accounting background to use it.
What should I do with the results?
Start by comparing the output against your current (or projected) monthly take-home. If the gap is big, walk back the inputs and identify which lever — pricing, volume, or cost structure — is doing the damage. That is usually where the highest-leverage fix lives.
The Bottom Line
Most operators lose money not because the math is impossible, but because they never actually ran it. Fifteen minutes with the calculator beats three months of guessing. Run your numbers, screenshot the output, and use it as the baseline for every pricing and cost decision over the next quarter.
When you are ready to go deeper, the full Digital Dashboard Hub workspace lets you save scenarios, track actuals month-over-month, and see the trend before problems compound. That is the version that actually compounds the effort — spreadsheets forgotten in a Google Drive folder do not.
Next Steps
- Run the calculator above with your best current estimates.
- Re-run it with a pessimistic scenario (lower volume, higher costs) and a stretch scenario (better pricing, more efficient ops).
- Screenshot all three outputs so you have a baseline to compare against when reality arrives.
- Revisit monthly — the number that matters is the one that changes with your real P&L.
Ready for the full dashboard?
Unlock all 255 tools across business, creator, and health workflows.

Andy Gaber is the founder of Digital Dashboard Hub, a suite of 255+ interactive financial, productivity, and wellness tools. He built DDH after getting frustrated with financial apps that gave outputs without context. Follow along for tool tutorials, revenue analytics breakdowns, and honest takes on personal finance.