Cleaning looks like a simple business on paper. Charge $175 per house, clean four houses per day, and you’re grossing $700/day — $180,000/year. Except: two houses are an hour apart. One client reschedules every third week. Your employee called out sick and you covered the job yourself on a day you’d planned to do admin. And the Tuesday you started late after a dentist appointment means you only got to three houses instead of four. Reality: you’re closer to $130K gross, working 55-hour weeks, and wondering where the money went.
I’m Andy, founder of Digital Dashboard Hub. I built the free Cleaning Business Revenue Calculator below because I’ve watched cleaning business owners run numbers on a whiteboard, feel great about the math, and then be surprised every single month when the bank account tells a different story. The calculator accounts for the gaps — drive time, cancellations, capacity utilization, and the actual cost per job.
Use the Free Cleaning Business Revenue Calculator
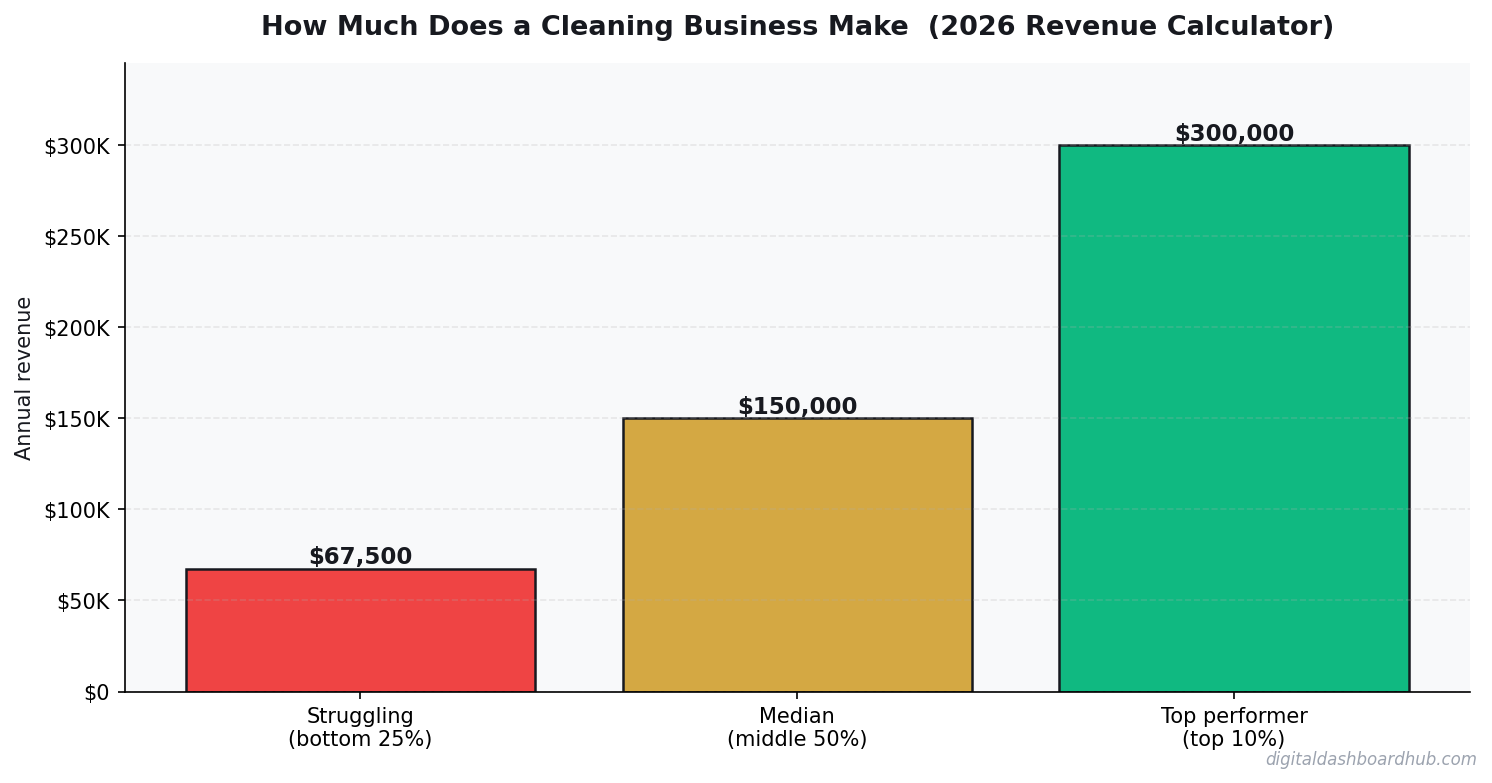
What Cleaning Business Owners Actually Take Home
Here’s what the numbers actually look like across different cleaning business models:
- Solo owner-operator (residential): $45K-$85K net on $90K-$150K gross (50-60% margin if you’re efficient)
- 2-3 employee residential company: $200K-$450K gross, 15-28% net
- Commercial cleaning (offices/retail): $150K-$800K gross, 18-30% net (more consistent clients, lower prices)
- Franchise model: Similar gross potential, 8-12% royalty fees cut into margin significantly
The solo owner-operator has the best margins because there’s no payroll overhead. The constraint is time — one person cleaning can realistically service 4-6 homes per day maximum. To scale past $150K gross, you need employees, and margins compress fast once you add payroll, workers’ comp, and the management time that comes with staff.
How the DDH Cleaning Revenue Calculator Works
Step 1: Enter your service types — standard recurring cleans, deep cleans, and move-out/move-in cleans separately. Each has different time requirements and pricing potential. Don’t lump them together; the margin difference is significant.
Step 2: Enter your client count by service type and frequency. The tool uses 80% capacity utilization as the default (accounting for cancellations and rescheduling, which average 15-20% for residential cleaning) — you can adjust based on your retention rate.
Step 3: Add your overhead: supplies per job, vehicle costs, insurance, payroll if applicable. The output shows projected monthly revenue, net profit by service type, and your effective hourly rate. Tracking every business expense by category is the only way to know whether your supply costs are actually under control.
| Business Model | Startup Cost | Revenue Ceiling | Net Margin | Hours/Week | Best For |
|---|---|---|---|---|---|
| Solo owner-operator | $1K-$5K | ~$140K | 45-60% | 40-55 | High independence, low overhead |
| Small employee company | $10K-$30K | $400K+ | 15-25% | 50-60 (mostly management) | Scaling revenue, less field work |
| Commercial contract cleaner | $5K-$20K | Unlimited | 18-28% | Flexible (off-hours) | Stable recurring revenue |
| Franchise | $50K-$150K | $500K+ | 8-18% | Management role | Brand + systems included |
The Real Lever: Client Retention, Not Volume
The most common advice in cleaning business growth is “get more clients.” That’s expensive and slow — acquiring a new recurring client costs 4-6x more than retaining an existing one. The actual revenue lever for most cleaning businesses is retention rate.
A cleaning company with 60 recurring clients and 8% monthly churn is replacing 5 clients every month just to stay flat. At $300 average acquisition cost (ads + referral program + time), that’s $1,500/month on client replacement before you grow by a single client. Drop churn to 3% and the same business keeps an extra $750/month in margin without finding a single new client.
If you’re thinking about the personal finance side — whether owning this business beats a W-2 after all the overhead — the contractor vs employee income comparison gives you the honest math. And if you’ve hit revenue targets but the savings account doesn’t reflect it, tracking your personal savings rate as a business owner usually reveals where it’s going.
Your Next Move
Right now (2 min): Run your last month’s actual jobs and revenue through the calculator. Compare actual net to what your spreadsheet projected.
This week: Calculate your monthly churn rate. If you’re losing more than 5% of clients per month, retention is your priority over acquisition.
Long game: Separate your pricing by service type. Deep cleans and move-outs should have their own pricing model that accounts for actual labor time.
Try the Cleaning Revenue Calculator Free →
Related Tools and Articles
- Depression Mood Tracker: How Tracking Your Mental Health Data Helps You Heal
- PCOS Symptom Tracking: How Monitoring Your Body Helps You Take Back Control
- Rent vs. Buy Calculator 2026: The True Cost of Each Option (Real Numbers)
Common Questions About How Much Does a Cleaning Business Make? (2026 Revenue Calculator)
How long does it take to see results?
Most people see meaningful progress within 30-90 days when they apply these strategies consistently. The key is tracking your numbers from day one so you have a baseline to measure against.
What’s the biggest mistake people make?
Trying to do everything at once. Pick one or two strategies from this guide, implement them fully, then layer in additional tactics. Spreading yourself thin is the fastest way to see no results from any of it.
Do I need special tools or software?
Not necessarily to start — but the right tools eliminate hours of manual work. Our free calculators and trackers at Digital Dashboard Hub are a good starting point before you invest in paid software.
A Real Cleaning Business P&L: Phoenix, Year Two
Residential cleaning company, 4 two-person crews. Running 22 jobs/week at an average ticket of $185 for a recurring clean. Here’s the actual monthly math:
- Gross revenue: $16,170/mo (22 jobs/wk × 4.33 weeks × $170 average recurring)
- Labor (cleaner pay + employer taxes): $7,600 (47%)
- Supplies and equipment: $480
- Commercial auto insurance: $390
- Liability insurance: $210
- Software, marketing, misc: $340
- Net owner income: ~$7,150/mo (44% margin)
That’s an excellent service business margin. The industry average for residential cleaning is 35-40% net. The Phoenix operator hits 44% because they kept the initial crew (lower turnover = lower retraining costs) and upsold deep-clean add-ons at a 60% take rate.
The 3 Numbers That Drive Cleaning Business Revenue
Recurring vs. One-Time Revenue Mix
One-time cleans pay more per job ($250-400) but have no predictability. Recurring clients (weekly, biweekly) pay less per visit but stack into reliable monthly income. The goal is 70%+ recurring revenue as fast as possible. At that level, you can forecast labor needs, plan routes, and sleep at night. Below 50% recurring, you’re constantly selling.
Geographic Route Density
Drive time is dead time. A crew driving 45 minutes between jobs will do 3 jobs/day. A crew with tight routes does 4-5. That’s a 33-67% productivity difference with no change in headcount. Filling geographic pockets — even at a slight discount to get a route anchor — pays back quickly in reduced drive time.
Upsell Rate on Add-Ons
Inside-oven cleaning, fridge cleaning, window washing. These add $40-80 to a ticket at near-zero incremental cost. A 50% upsell rate on a base of 22 jobs/week at $50 average add-on = $2,860/mo in additional revenue. Most cleaning businesses leave this entirely on the table.
Keep reading (related guides):
- Auto Mechanic Revenue: What Owners Make vs. What Youd Expect (2026)
- Boutique Revenue Calculator
- How Much Does a Boutique Make? (2026 Revenue Calculator)
- Why Most Goal-Setting Systems Fail Creators (And the One Framework That Doesnt)
- Rent vs. Buy Calculator 2026: The True Cost of Each Option (Real Numbers)
255+ interactive tools for your money, time, and health.
14 days free · No charge today · 2-click cancel
What Most People Get Wrong
The single biggest mistake is treating revenue as the headline number. Revenue is vanity — margin is sanity, and cash-in-bank is reality. Two operators with identical top-lines routinely end the year $80K apart in take-home, because one priced for volume and the other priced for sustainability. The calculator above forces you to surface that gap before it hits your bank account.
The second mistake is modeling a “best case” and planning around it. The number you should plan around is the 30th-percentile scenario — enough demand to matter, but slower than you hoped. If the business still covers your living expenses there, you have real margin of safety. If it only works in the 80th-percentile case, you are building on sand.
The third mistake is ignoring your time as a cost. If you would otherwise earn $55/hr at a day job and this operation pays you effectively $18/hr for 60-hour weeks, the gap is the real price of running it. Plug your opportunity cost into the calculator and the picture often flips.
How to Pressure-Test Your Numbers
Start with the calculator, then stress-test three levers independently:
- Pricing: What happens to your take-home if you raise prices 10%, but lose 15% of volume? Most operators are surprised to find net income goes up.
- Costs: What happens if your largest input cost rises 20%? This is not hypothetical — it is a typical 12-month swing in most industries.
- Volume: What happens at 70% of your planned volume for 90 days? If that still covers fixed costs, you have a real business. If not, the model is fragile.
Running the calculator three ways takes about ten minutes. The clarity on the other side of those ten minutes is usually the difference between a confident operating plan and guessing for another six months.
Frequently Asked Questions
How accurate is this calculator?
The underlying math uses industry-standard margin and cost ranges sourced from the How Much Does a Cleaning Business Make? space. Your actual numbers depend on location, seasonality, and operating style, so treat this as a directional benchmark, not a guarantee. The more precisely you enter your inputs, the tighter the output range becomes.
Can I save my results?
A free Digital Dashboard Hub account saves every scenario you run, lets you compare side-by-side, and unlocks the full dashboard with expense tracking and month-over-month charts. The 14-day trial includes the complete tool library — no credit card required to start.
Who is this tool for?
It’s built for anyone pressure-testing a real decision — existing operators auditing their margins, side-hustlers deciding whether to go full-time, and prospective owners trying to sanity-check a business plan before signing a lease. You do not need any accounting background to use it.
What should I do with the results?
Start by comparing the output against your current (or projected) monthly take-home. If the gap is big, walk back the inputs and identify which lever — pricing, volume, or cost structure — is doing the damage. That is usually where the highest-leverage fix lives.
The Bottom Line
Most operators lose money not because the math is impossible, but because they never actually ran it. Fifteen minutes with the calculator beats three months of guessing. Run your numbers, screenshot the output, and use it as the baseline for every pricing and cost decision over the next quarter.
When you are ready to go deeper, the full Digital Dashboard Hub workspace lets you save scenarios, track actuals month-over-month, and see the trend before problems compound. That is the version that actually compounds the effort — spreadsheets forgotten in a Google Drive folder do not.
Next Steps
- Run the calculator above with your best current estimates.
- Re-run it with a pessimistic scenario (lower volume, higher costs) and a stretch scenario (better pricing, more efficient ops).
- Screenshot all three outputs so you have a baseline to compare against when reality arrives.
- Revisit monthly — the number that matters is the one that changes with your real P&L.
Ready for the full dashboard?
Unlock all 255 tools across business, creator, and health workflows.
Andy Gaber is the founder of Digital Dashboard Hub, a suite of 255+ interactive financial, productivity, and wellness tools. He built DDH after getting frustrated with financial apps that gave outputs without context. Follow along for tool tutorials, revenue analytics breakdowns, and honest takes on personal finance.