Running a Small Business Should Not Require Enterprise Software
Before DDH, I was doing this manually in spreadsheets. Here’s the faster way:
If you run a business with one to ten employees, you already know the frustration. Enterprise project management tools are built for companies with hundreds of people and budgets to match. They are bloated, overpriced, and require a dedicated admin just to keep them running. On the other end, consumer-grade to-do apps and basic spreadsheets fall apart the moment you try to coordinate work across even a small team, track client deliverables, or get a clear view of how the business is actually performing.
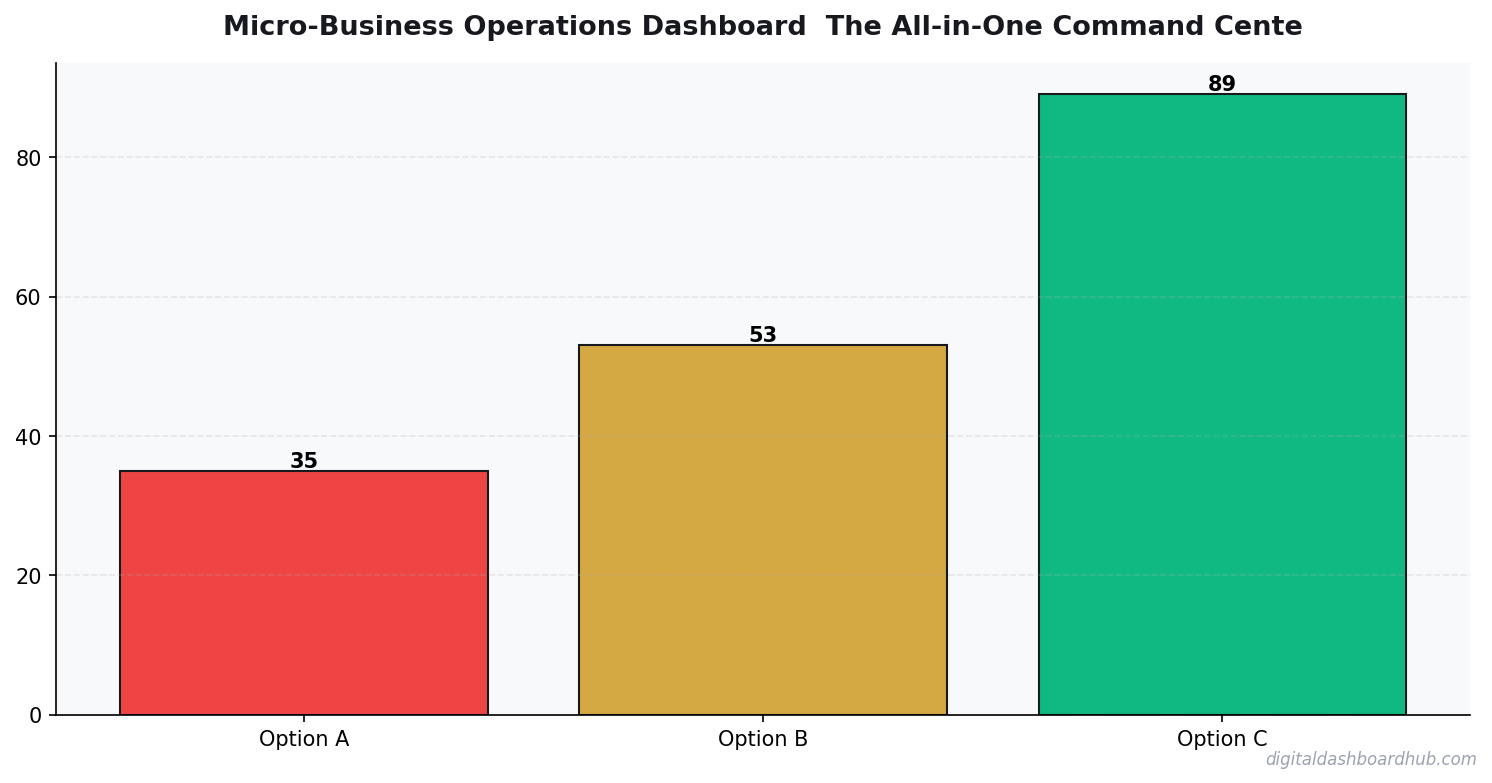
The Micro-Business Operations Dashboard exists in the space between those two extremes. It is an all-in-one command center designed specifically for businesses under ten employees — the solopreneurs who are scaling, the boutique agencies managing multiple clients, the consultancies juggling projects, and the local businesses going digital for the first time. Everything you need to run your operation lives in one place, without the complexity that makes enterprise tools unusable for small teams.
What the Operations Dashboard Does
Task and Project Tracking Built for Small Teams
Assign tasks, set deadlines, track progress, and see the status of every active project at a glance. The interface is designed for teams that do not have a project manager — it is intuitive enough that everyone on your team can update their own tasks without training, and clear enough that you can see the full picture without drilling into individual items. Projects are organized by client, priority, or team member depending on how your brain works, and the dashboard surfaces overdue items and approaching deadlines automatically so nothing falls through the cracks.
Team Workload Visibility
When you are managing a small team, it is easy to accidentally overload your best performer while others have capacity. The workload view shows each team member’s current assignments, estimated hours, and completion rates. You can spot imbalances before they cause burnout or missed deadlines and redistribute work in real time. For solopreneurs, this same view tracks your own capacity and helps you make realistic commitments to clients based on actual availability rather than optimistic guessing.
Client Pipeline Management
Track every prospect from initial contact through proposal, negotiation, and close. See your pipeline value, conversion rates, and average deal timeline. Know exactly how much potential revenue is in each stage so you can forecast income and make smart decisions about capacity. When a new lead comes in, you can instantly see whether you have bandwidth to take them on or whether you need to adjust timelines for existing work. Managing your pipeline effectively ties directly into managing your overall business finances with clarity.
Financial Snapshot
You do not need a full accounting suite to understand how your business is performing financially. The operations dashboard includes a financial snapshot that shows revenue this month versus last month, outstanding invoices, upcoming expenses, and basic profit margin calculations. It is not a replacement for your accountant — it is the daily pulse check that tells you whether the business is healthy right now. For deeper financial tracking, it integrates easily with our freelancer-focused financial tools.
Time Tracking Integration
For service-based businesses that bill by the hour or need to understand where time actually goes, the built-in time tracking connects directly to projects and clients. Log time against specific tasks, see total hours by project or client, and compare estimated versus actual time to improve your quoting accuracy over time. The data also reveals which types of work consume disproportionate time relative to revenue, helping you make strategic decisions about your service offerings.
Automated Weekly Reports
Every Monday morning, the dashboard generates a summary of the previous week: projects completed, tasks overdue, revenue collected, pipeline changes, and team utilization. No manual report building required. You start the week with a clear picture of where things stand and what needs attention, which means your Monday planning meeting (if you even need one) takes ten minutes instead of an hour.
Who This Dashboard Is Built For
| Option | Cost | Time Investment | Customizable? | Best For |
|---|---|---|---|---|
| DIY approach | Free | High | Fully | Those with time to build from scratch |
| Generic tool | $5-$50/mo | Medium | Limited | Standard use cases |
| DDH Free Tool | Free trial | 5-10 min setup | Yes | Getting real answers without spreadsheet hell |
Solopreneurs who are scaling and feeling the growing pains of managing more clients, more projects, and potentially their first hires. The dashboard grows with you — start using it solo and gradually add team members as your business expands, without needing to migrate to a new platform.
Boutique agencies and small studios managing multiple client accounts simultaneously. When you have three to eight people handling a dozen active projects, the operational complexity explodes. This dashboard keeps everyone aligned without the overhead of enterprise project management tools. Tracking revenue per project alongside time invested gives you the same insights that help product-based businesses identify their most profitable offerings.
Consultancies and professional service firms that need to track billable hours, manage client relationships, and maintain visibility into project profitability. The combination of time tracking, client management, and financial snapshot features was designed with service-based businesses in mind.
Local businesses going digital for the first time. Whether you are a contractor, a salon owner, a small retail operation, or any other local business that has been running on paper and memory, this dashboard provides the digital infrastructure to professionalize your operations without overwhelming you with features you do not need.
Why One Dashboard Beats Five Separate Tools
Most micro-businesses end up with a patchwork of tools: Trello for tasks, a spreadsheet for finances, email for client communication, a separate app for time tracking, and maybe a CRM they set up once and never maintained. The problem is not that any individual tool is bad — it is that the information lives in silos. You cannot see how a delayed project affects your cash flow without switching between three apps and doing mental math.
A unified operations dashboard connects all of these data points. When a project runs over its estimated hours, you see the impact on profitability immediately. When a client’s invoice is overdue, it shows up alongside their active projects so you have full context. When your team is at capacity, the pipeline view reflects that reality in your sales forecasts. The same approach to consolidating financial tracking applies to operations — seeing everything in one place changes how you make decisions.
This integration is not just convenient — it is strategically valuable. Small businesses that can see operational, financial, and client data in one view make faster, better decisions than those who have to assemble that picture manually from multiple sources. In a competitive market, that speed and clarity is a genuine advantage.
Simple Setup, Immediate Value
The dashboard takes less than fifteen minutes to set up. Add your team members, create your active projects, and start tracking. There is no complex configuration, no mandatory training, and no features hidden behind premium tiers that you need to unlock. Every feature described above is available from day one, and the interface is clean enough that your team will be using it effectively within their first session.
If you are tired of switching between five different tools to understand how your business is running, or if you are still relying on memory and spreadsheets to manage growing operational complexity, the Micro-Business Operations Dashboard gives you the visibility and control you need without the enterprise-level headaches you absolutely do not. Your financial strategy and your operational strategy deserve to live under the same roof.
Try the Micro-Business Operations Dashboard Free
Keep reading (related guides):
- Business Expense Tracker: Categorize and Export for Tax Time
- How to Start an Amazon FBA Business: Month-by-Month Revenue Expectations
- Micro-Business Operations Dashboard (CSL): Your All-in-One Command Center for Running a Lean Business
- Micro-Business Operations in 2026: Enterprise Tools vs. DIY Stacks vs. All-in-One Platforms Compared
- Bakery Revenue Calculator
255+ interactive tools for your money, time, and health.
Full features for 14 days · Secure payment · Stop anytime
Andy Gaber is the founder of Digital Dashboard Hub, a suite of 255+ interactive financial, productivity, and wellness tools. He built DDH after getting frustrated with financial apps that gave outputs without context. Follow along for tool tutorials, revenue analytics breakdowns, and honest takes on personal finance.