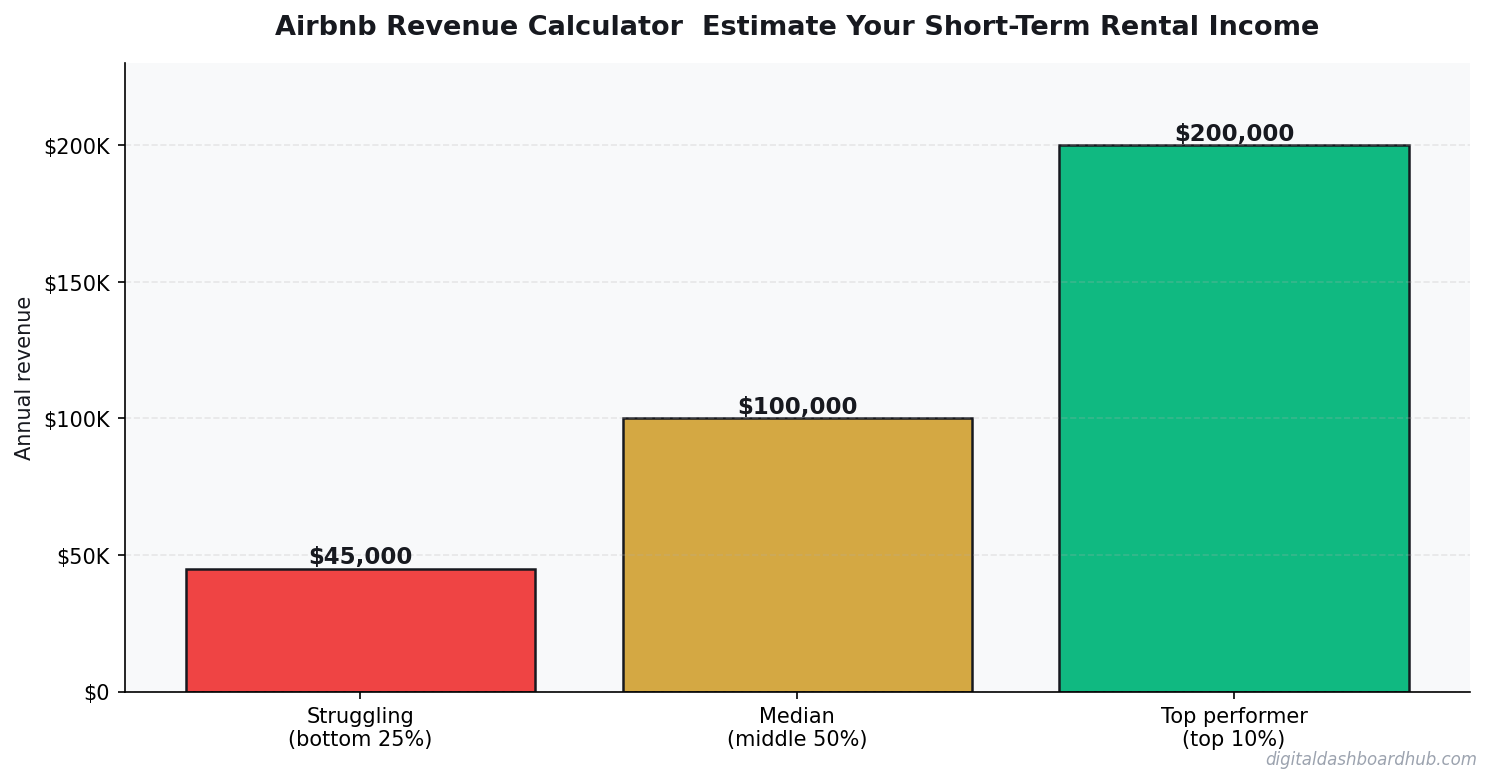
You’ve got a spare room, a guest house, or a property that could list on Airbnb. Everyone tells you it’s “passive income.” What they don’t tell you is that after platform fees, cleaning costs, supplies, and the weeks it sits vacant, your actual profit is often 40–60% of your gross revenue.
The DDH Airbnb Revenue Calculator gives you the real number. Enter your location, expected nightly rate, and occupancy assumptions — and get a realistic monthly profit projection before you spend money on a listing, furniture, or a property manager.
Why Gross Revenue Is a Lie
I launched Digital Dashboard Hub because the tools I found online were either too generic or too complicated. Here’s the honest breakdown:
Here’s the math that actually happens:
- Airbnb service fee (3%): -$90
- Cleaning/turnover costs: -$150
- Supplies and restocking: -$100–150
- Maintenance and repairs: -$75–200
- Utilities increase: -$50–100
- Platform-adjusted occupancy (actual: 12–16 nights, not 20): ↓
Real monthly profit: $1,400–1,800. Still good. But not $3,000. The Airbnb revenue calculator makes this accounting automatic.
What the Calculator Shows
- Gross monthly revenue (nightly rate × projected occupied nights)
- Airbnb fees (automatically calculated at 3% host fee)
- Operating expenses (cleaning, supplies, utilities, maintenance)
- Net monthly profit
- Annual revenue projection
- Break-even occupancy rate
Setting Realistic Occupancy Rates
| Market Type | Typical Occupancy | Notes |
|---|---|---|
| Top 25 US cities | 55–75% | Competitive; requires strong listing |
| Mid-tier markets | 40–60% | More achievable for new hosts |
| Rural/seasonal | 25–50% | High peaks, low valleys |
| New listing (first 3 months) | 30–50% | Algorithm boost helps, then stabilizes |
FREE BONUS: The Airbnb Host Startup Cost Checklist
Every expense you’ll face in month one — furniture, supplies, photography, legal — so you can set a real budget.
Get instant access → app.digitaldashboardhub.com/signup
How the DDH Airbnb Revenue Calculator Works
Let’s model a real scenario: a 1-bedroom condo in a mid-tier market. Average nightly rate: $125. Expected occupancy: 55% (about 16–17 nights/month).
Step 1: Enter nightly rate ($125), occupancy (55%), and property type (1BR).
Step 2: The calculator computes gross revenue: $125 × 16.5 nights = $2,063/month.
Step 3: Deduct platform fees and expenses:
- Airbnb host fee (3%): -$62
- Cleaning/turnover: -$150
- Supplies: -$80
- Utility increase: -$60
- Maintenance reserve: -$188
Net monthly profit: $1,523. Annual: $18,276.
Now model the downside: 35% occupancy (slow season). Revenue drops to $1,313. After the same expenses: $771/month. Still positive — but barely. If your mortgage is $1,400/month, you’re supplementing, not replacing it.
→ Try the DDH Airbnb Revenue Calculator free: app.digitaldashboardhub.com/signup
The Costs New Hosts Consistently Underestimate
Cleaning turnover: If you charge guests a cleaning fee but use a professional service, you’re often breaking even — or losing $20–50 per clean at high frequency.
Supplies: Toilet paper, toiletries, coffee, kitchen basics. At $8–12 per stay for a well-stocked unit, 15 stays/month = $120–180 in consumables.
The “free months”: Most experienced hosts plan for 2 seasonal low months per year at 25–30% occupancy. Model these in your annual projection, not just your average month.
STR vs. Long-Term Rental: The Calculator Comparison
The calculator also shows how your expected STR revenue compares to a traditional 12-month lease at current market rents. For some properties and markets, the long-term rental is more profitable when you factor in the management time and operating costs of STR. For vacation markets and high-demand urban areas — STR wins by 40–80%.
Run both scenarios. The answer isn’t always obvious.
Your Next Move
Right now (2 minutes): Look up comparable Airbnb listings in your market. Enter that average nightly rate into the calculator and see your realistic profit range.
This week: Model three scenarios — optimistic, realistic, conservative — and make sure you’re profitable even in the conservative case before you invest in setup costs.
Long game: Track your actual monthly revenue and expenses in the DDH dashboard and compare to your projections. Adjust your nightly rate seasonally based on actual occupancy data.
Still here? You’re serious about making this work.
Join 1,200+ people running their STR numbers through DDH before they list.
Calculate your real profit → app.digitaldashboardhub.com/signup
A Real Airbnb Scenario: Nashville, 2BR Condo
A 2-bedroom condo 15 minutes from downtown Nashville: Listed at $185/night weeknights, $225/night weekends. Occupancy rate: 71% (about 22 nights/month). Monthly gross: ~$4,500. Cleaning fee (passed to guest): $85/booking, averaging 6 bookings/month = $510 offset against cleaning costs.
Expenses: Airbnb host fee (3%): $135, cleaning service ($450/month), supplies/toiletries ($80), mortgage/rent ($1,800), utilities ($220), property management app ($30). Net: $2,295/month or about $27,500 annually. Decent, but you’re not getting rich — you’re getting a mortgage largely covered with side income. That’s still a strong outcome.
The 3 Factors That Move Airbnb Revenue Most
Location premium. Walkability to entertainment, restaurants, or events can double your per-night rate. A condo 8 minutes from downtown Nashville versus 25 minutes might command $185 versus $95 per night — same square footage, radically different economics. Location is the factor you can least change, but the most important to model correctly before buying or listing.
Dynamic pricing. Hosts who adjust rates daily based on demand — using tools like PriceLabs or Wheelhouse — earn 20-35% more than hosts who set a flat rate and forget it. This isn’t optional in competitive markets; it’s the difference between 60% and 75% occupancy.
Review velocity. The first 10 reviews make or break the listing’s search ranking. Everything — response time, cleanliness, check-in smoothness — should be optimized for the first 90 days to build the review base that drives organic ranking long-term.
What the Airbnb Arbitrage Model Actually Looks Like
Rental arbitrage — renting a property long-term and subletting it short-term — was popular for a few years and has mostly collapsed in high-competition markets. The model requires landlord permission (increasingly rare), reliable 70%+ occupancy (not guaranteed in saturated markets), and enough margin between long-term rent and short-term revenue to justify the risk and effort. In most major cities, the math barely works in 2026.
The Airbnb opportunity that still makes clear financial sense is hosting a property you already own — your primary home (renting a room or your full place during travel), a vacation property you’d otherwise leave vacant, or an investment property you purchased with STR economics in mind. The margin is real. The arbitrage version is mostly a race to the bottom in competed markets.
When Airbnb Stops Making Sense
The math stops working when local STR regulations tighten, when your property is in a market with 70%+ Airbnb saturation, or when your mortgage + operating costs require 85%+ occupancy to break even. Before listing, stress-test your numbers at 55% occupancy — because that’s what a bad month looks like. If you can’t stay cash-positive at 55%, you don’t have a margin of safety. You have a bet. Know which one you’re making before you buy the furniture.
One operational note that separates five-star hosts from average ones: create a digital guidebook with everything a guest might need — WiFi password, nearest grocery store, parking instructions, checkout procedures, local restaurant recommendations. Guests who feel oriented from the moment they arrive leave better reviews, ask fewer questions, and cause fewer problems. A $0 investment that pays in reviews and repeat bookings.
Keep reading (related guides):
- True Cost of Your Mortgage Calculator: Its More Than the Payment
- Rental Property ROI Calculator: Is This Deal Actually Worth It?
- Wedding Budget Breakdown: Where Every Dollar Should Go (Free Calculator)
- Homeownership vs. Renting for 30 Years: The Complete Financial Comparison
- Bakery Revenue Calculator
255+ interactive tools for your money, time, and health.
Instant signup · Stripe-secure · Cancel in one click
Keep Reading
- Rental Property ROI Calculator: Is This Deal Actually Worth It?
- Side Hustle Income & Tax Tracker: The Free Dashboard
- The Side Hustle Tax Trap: How to Track Every Dollar
Common Questions About Airbnb Revenue Calculator: Estimate Your Short-Term Rental Income Before You List
How long does it take to see results?
Most people see meaningful progress within 30-90 days when they apply these strategies consistently. The key is tracking your numbers from day one so you have a baseline to measure against.
What’s the biggest mistake people make?
Trying to do everything at once. Pick one or two strategies from this guide, implement them fully, then layer in additional tactics. Spreading yourself thin is the fastest way to see no results from any of it.
Do I need special tools or software?
Not necessarily to start — but the right tools eliminate hours of manual work. Our free calculators and trackers at Digital Dashboard Hub are a good starting point before you invest in paid software.

Andy Gaber is the founder of Digital Dashboard Hub, a suite of 255+ interactive financial, productivity, and wellness tools. He built DDH after getting frustrated with financial apps that gave outputs without context. Follow along for tool tutorials, revenue analytics breakdowns, and honest takes on personal finance.